In this series: State Recovery | Red Lake Crisis | Rochester's Stubborn Rate | Pequot Lakes Turnaround | Poverty-Absence Nexus | Minneapolis Volatile Trajectory | Districts at All-Time High | Consistent Attendance Leaders | Moorhead Escalating
Correction (July 22, 2026): Earlier versions calculated racial shares using an incomplete subgroup denominator, misstated Minnesota's recent statewide trend and special-education enrollment share, and said disproportionality ran in the same direction for every non-white group. The corrected figures use all-student enrollment and chronic-absence totals, and the broader claim has been narrowed to the groups supported by those figures. External numeric, causal, and hypothetical claims not established by the state files were removed. The Black-white subgroup rates and the central 25.3-point gap are unchanged.
Correction (August 22, 2026): A refreshed Minnesota source file now supplies a compatible enrollment denominator for Native American students in 2020-21. The article adds that reported racial group, updates the free/reduced-price lunch, English learner, and special-education rates and gaps, and updates the special-education enrollment share. The post-2021 subgroup-data gap remains.
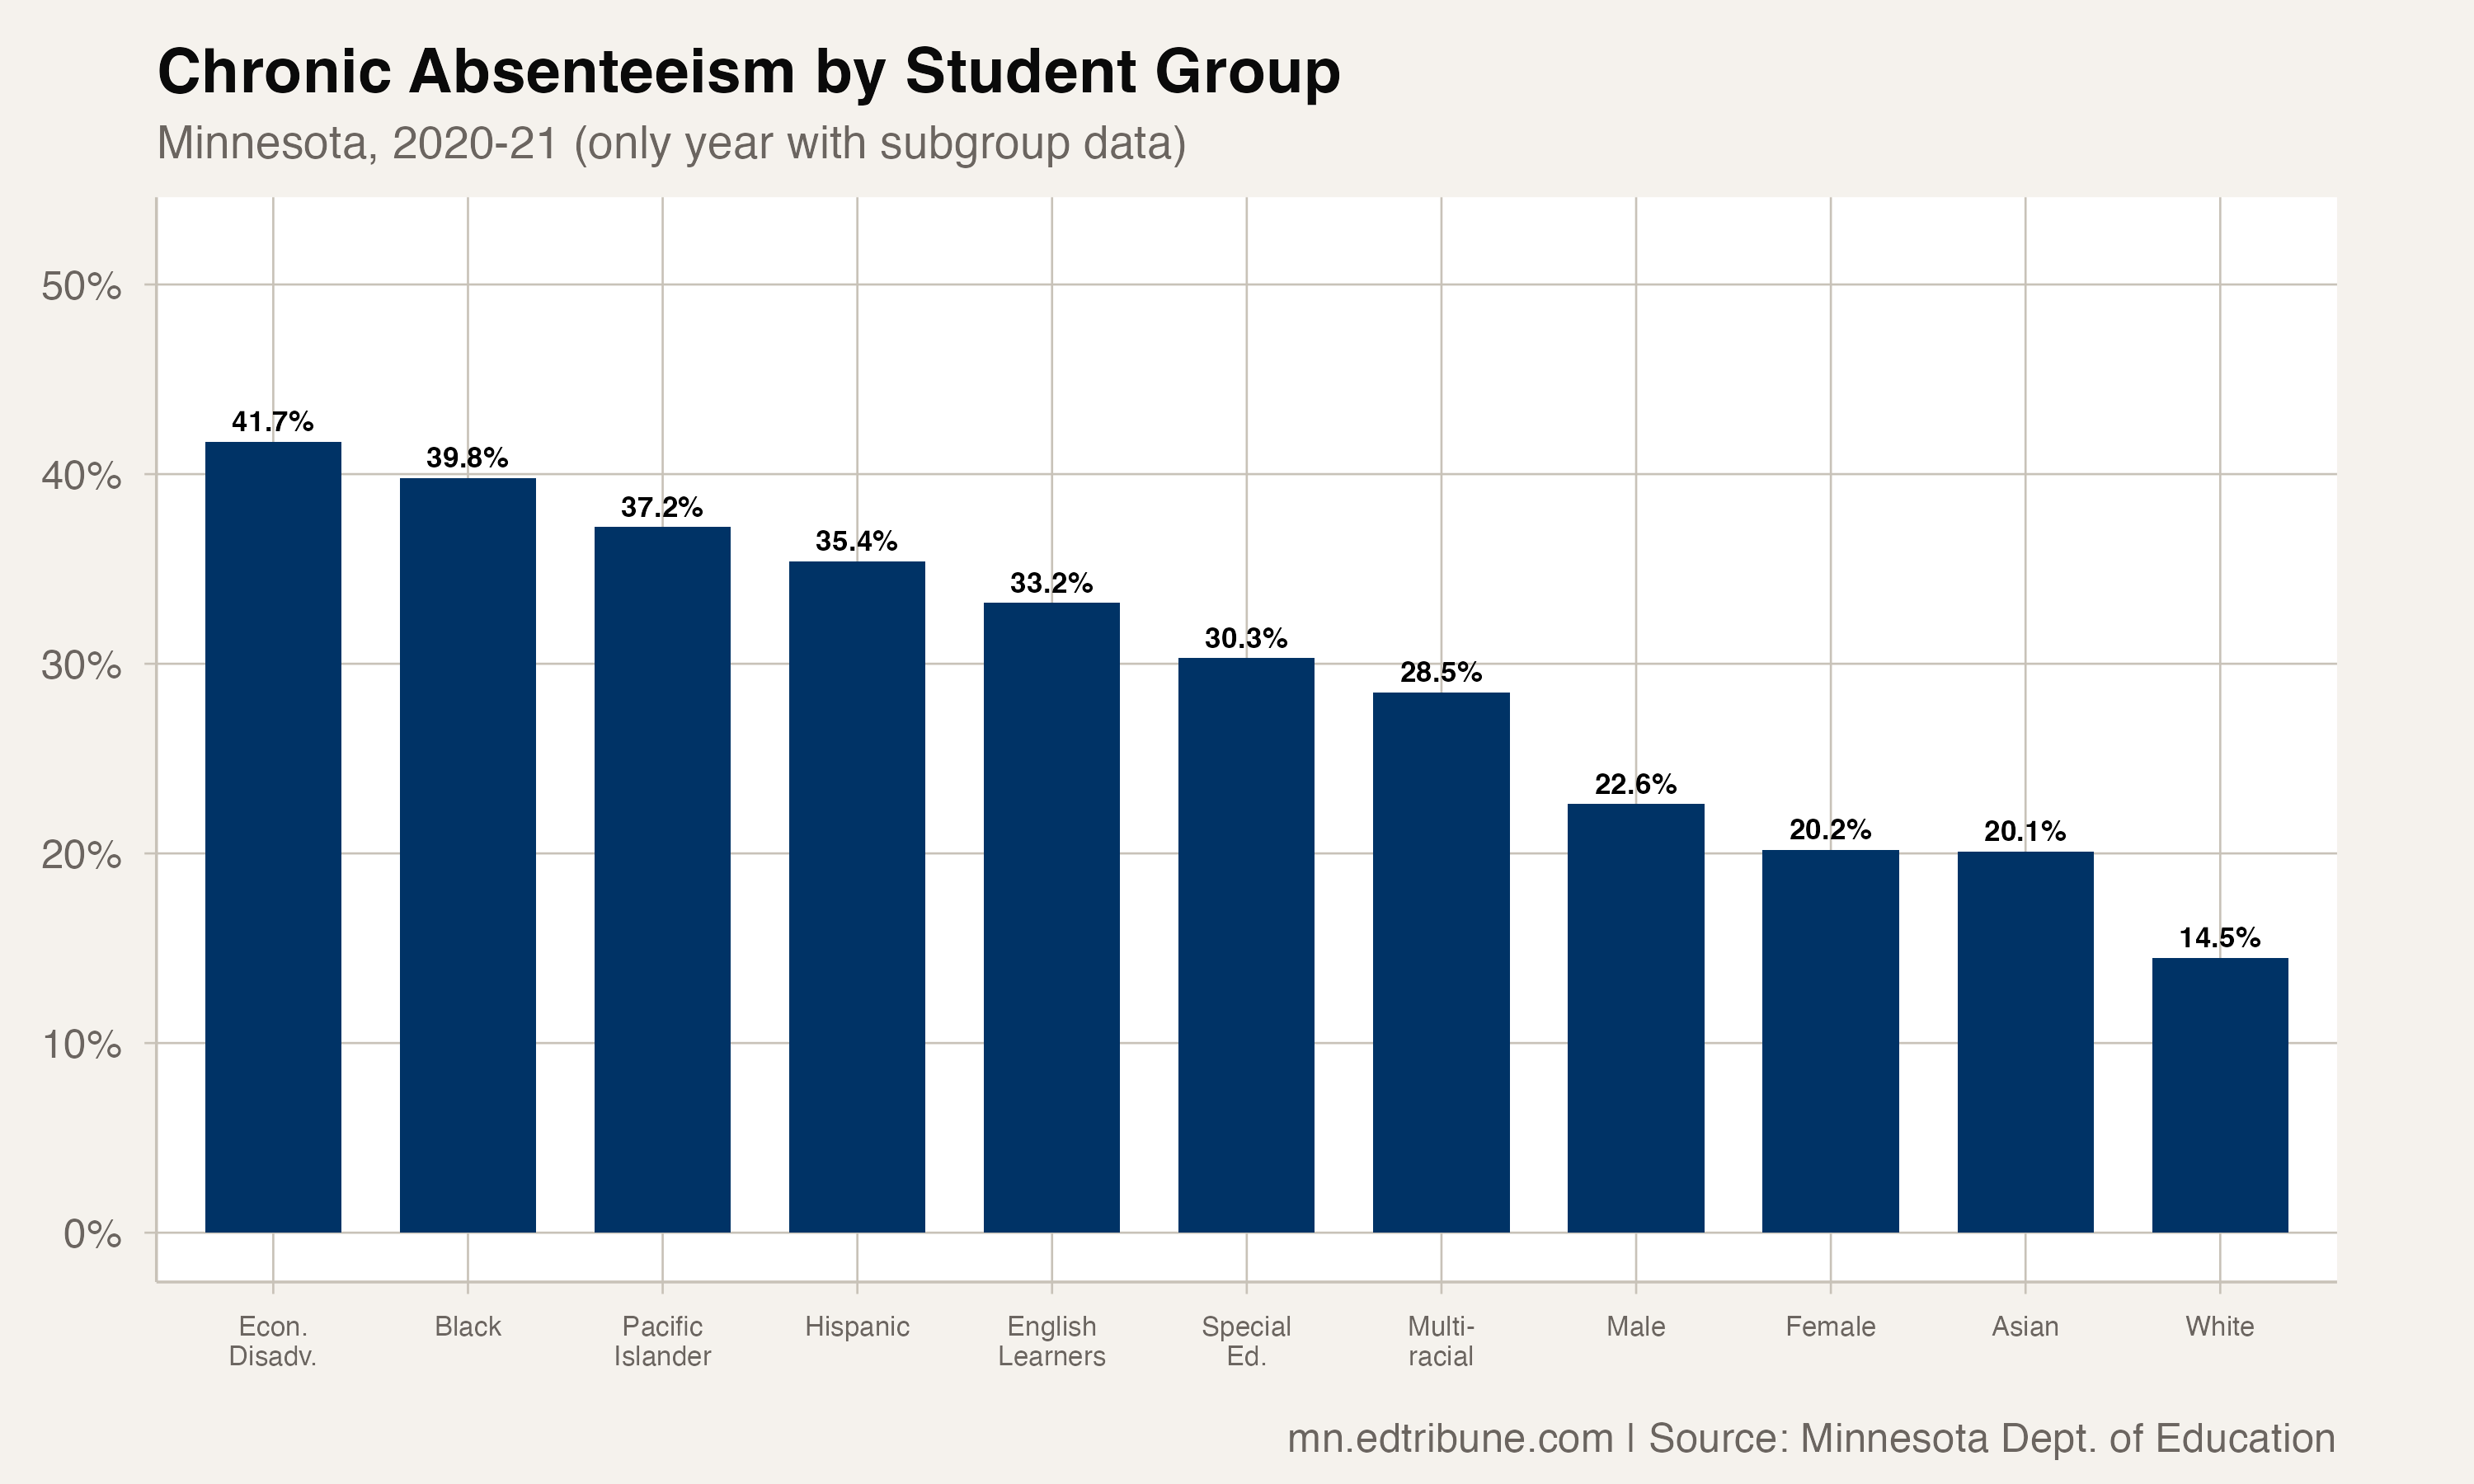
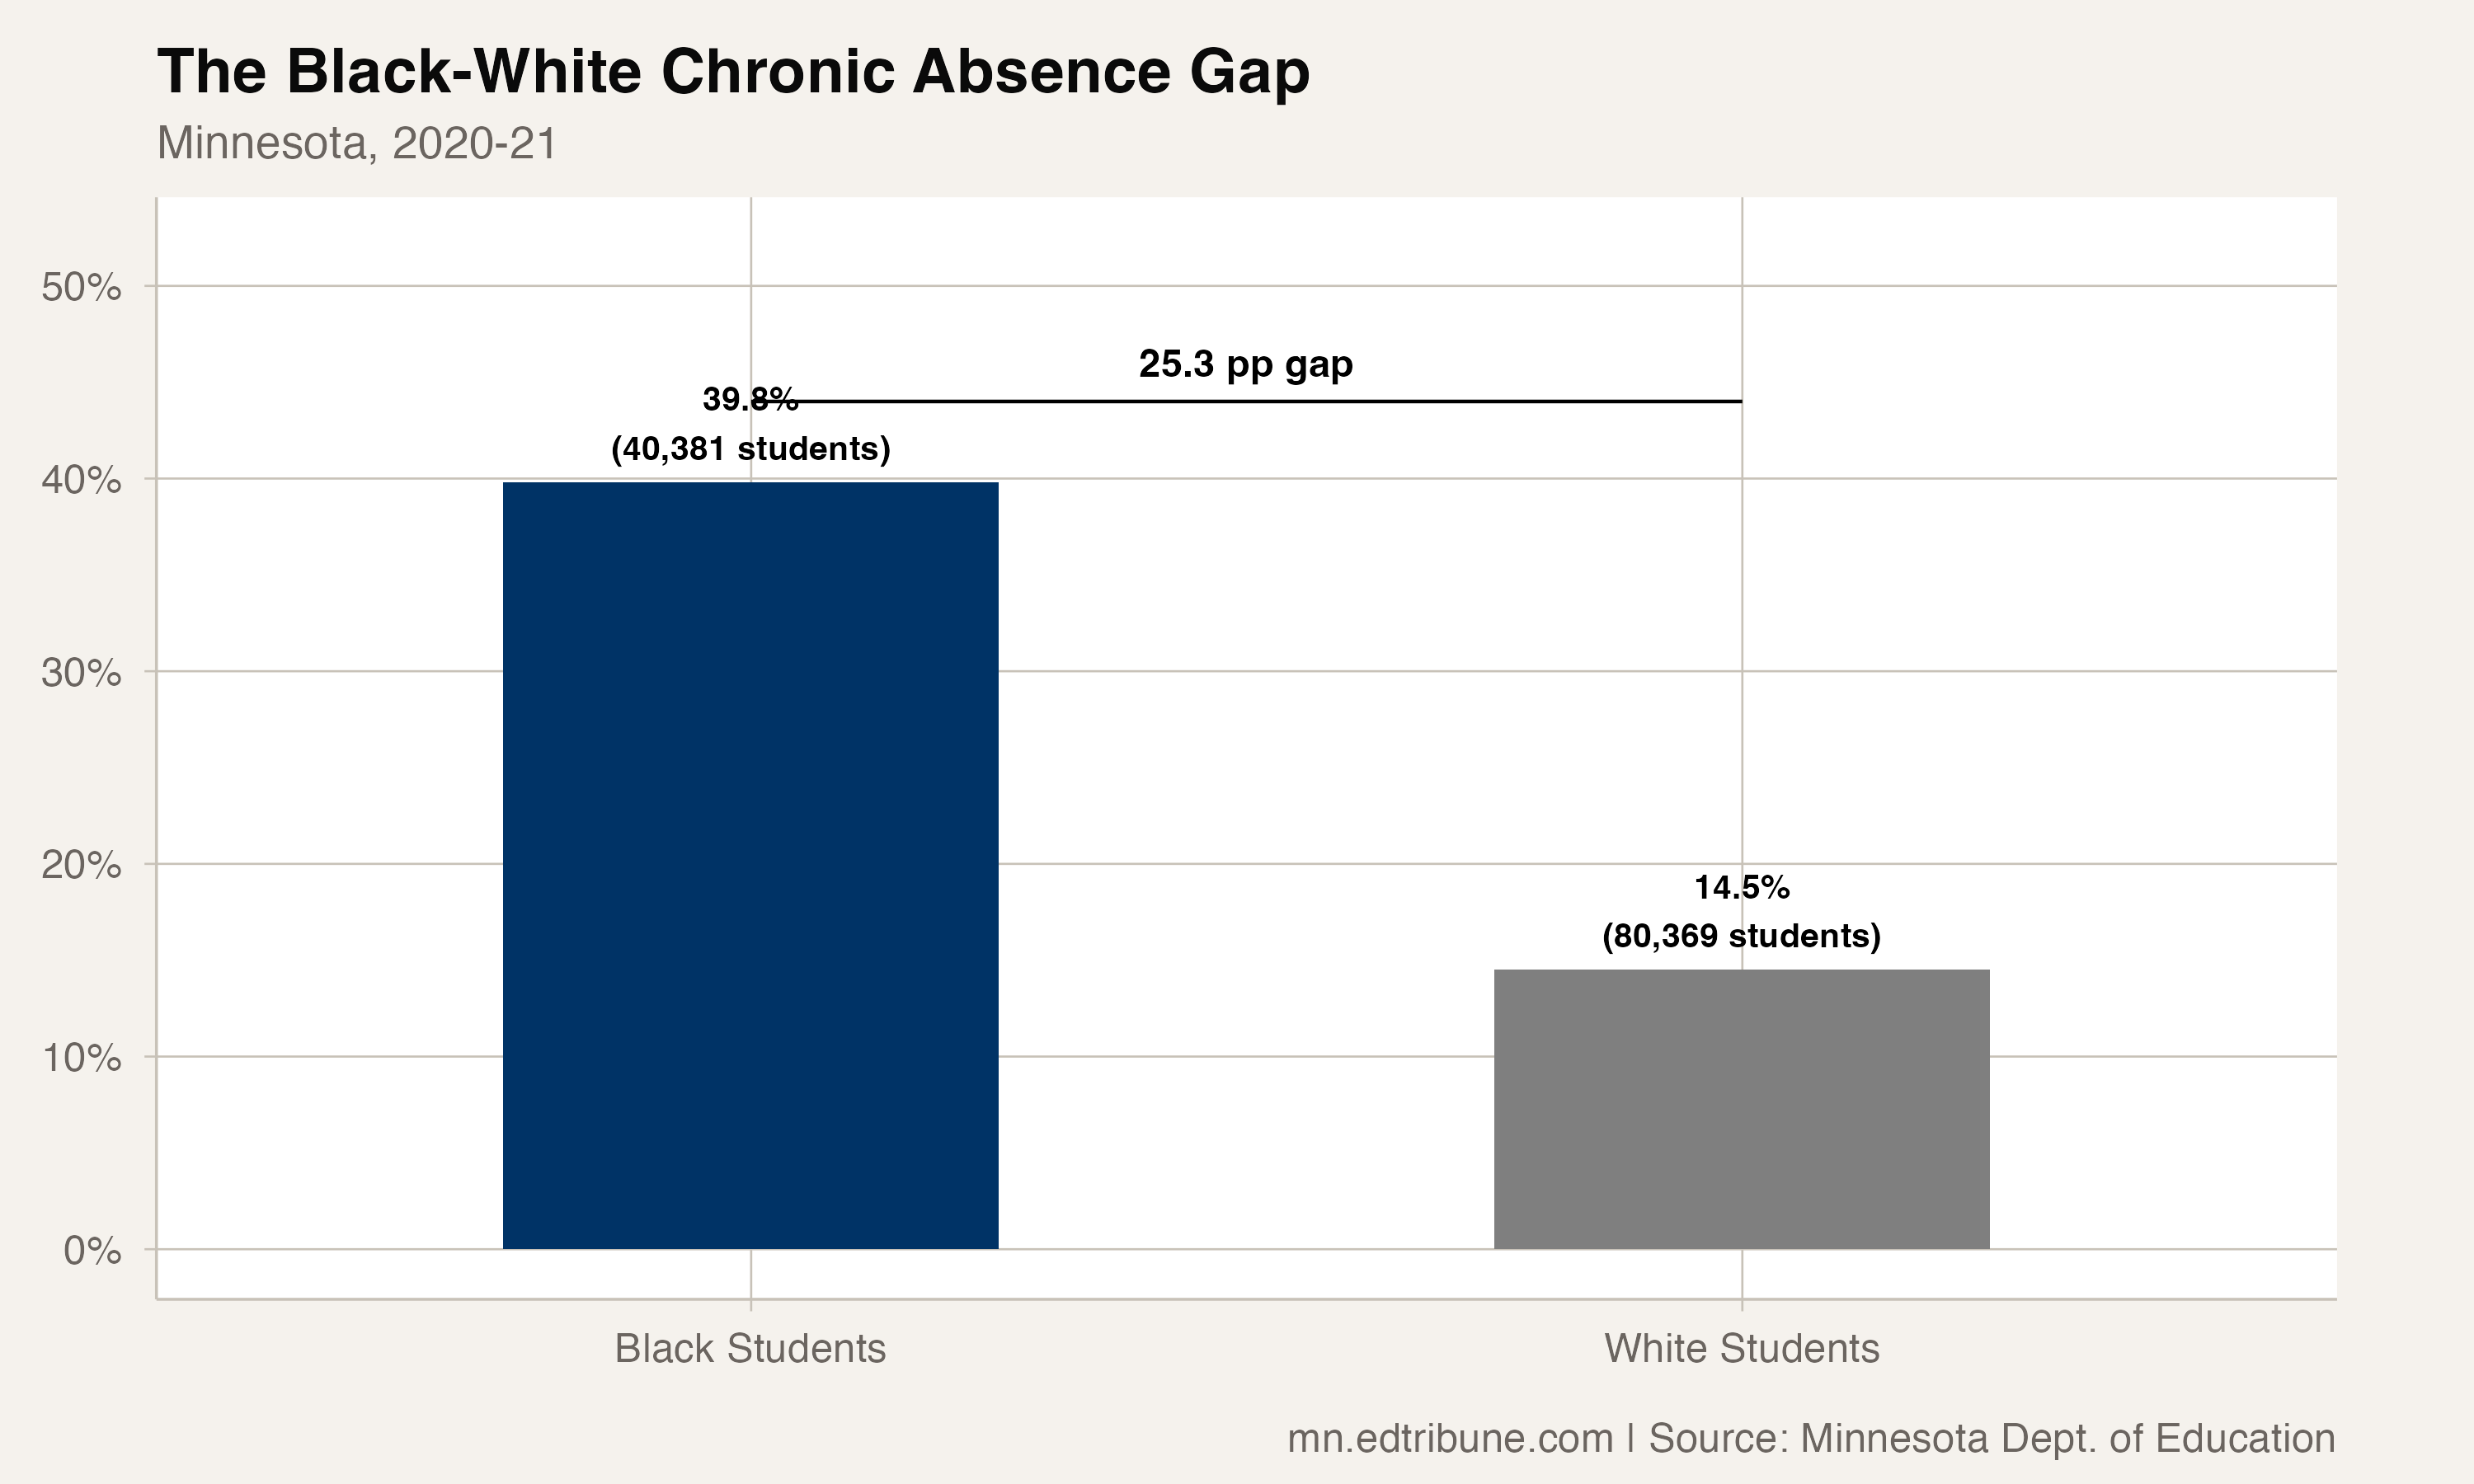
In the 2020-21 school year, nearly 40% of Black students in Minnesota were chronically absent. Among white students, the rate was 14.5%.
That 25.3 percentage point gap means the Black rate was 2.74 times the white rate. It translated to 40,381 Black students classified as chronically absent, more students than the total enrollment of any Minnesota district in the package's 2020-21 data.
The package returns usable statewide racial counts for 2020-21 only. In each of the next three available years, the non-total subgroup rows contain zero counts, so rates and gaps cannot be calculated. The state files provide one usable snapshot of this attendance inequity and do not show whether it later narrowed or widened.
Every group above the white baseline
Among the six non-white racial categories with both a chronic-absence count and a compatible enrollment denominator in 2020-21, every rate was higher than the white rate.
| Student Group | Chronic Rate | Students Absent | Gap from White |
|---|---|---|---|
| Native American | 55.2% | 8,327 | +40.7 pp |
| Free/reduced-price lunch eligible | 40.6% | 113,736 | +26.1 pp |
| Black | 39.8% | 40,381 | +25.3 pp |
| Pacific Islander | 37.2% | 307 | +22.7 pp |
| Hispanic | 35.4% | 31,242 | +20.9 pp |
| English learners | 33.1% | 24,279 | +18.6 pp |
| Special education | 29.9% | 43,468 | +15.4 pp |
| Multiracial | 28.5% | 14,200 | +14.0 pp |
| Male | 22.6% | 101,521 | +8.1 pp |
| All students | 21.5% | 187,067 | +7.0 pp |
| Female | 20.2% | 85,546 | +5.7 pp |
| Asian | 20.1% | 12,241 | +5.6 pp |
| White | 14.5% | 80,369 | -- |
Native American students had the highest reported rate at 55.2%. The Black-white comparison shows a 25.3-point gap among the reported racial rates.
Disproportionate impact by the numbers
The raw numbers tell an even starker story about who bears the burden of chronic absence.
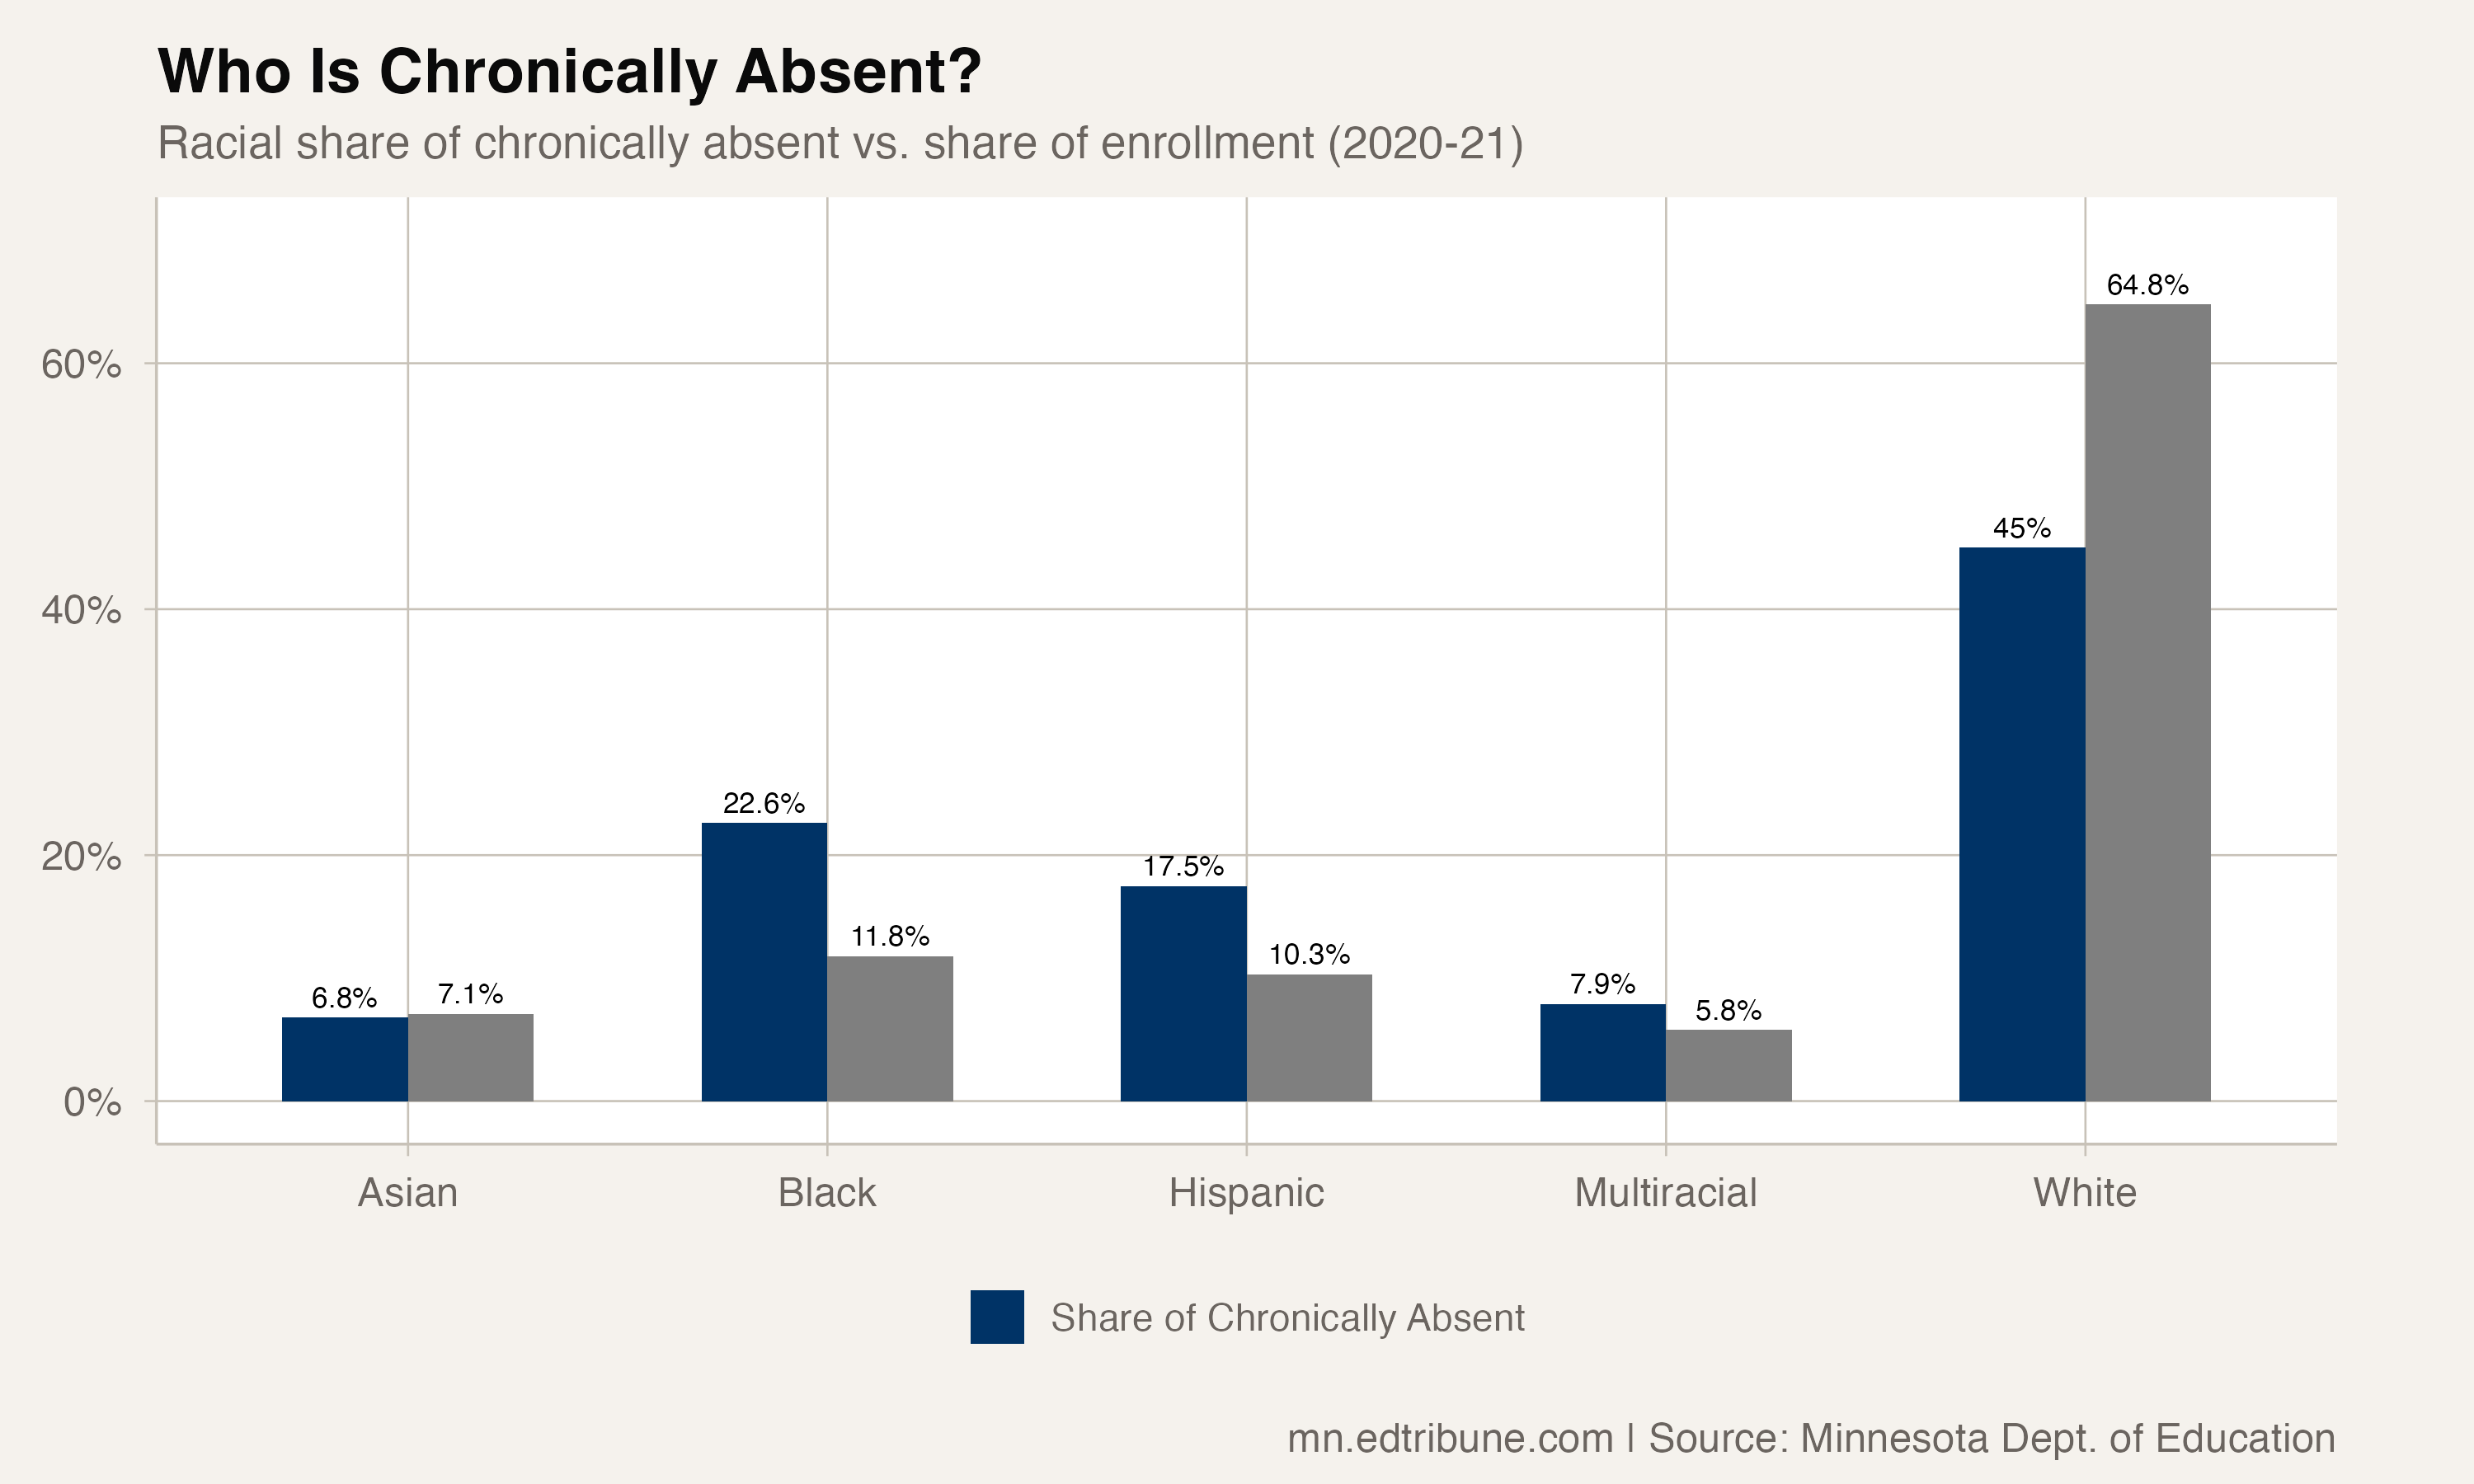
Black students made up 11.6% of Minnesota's enrollment in 2020-21 but accounted for 21.6% of all chronically absent students, a 10.0 percentage point difference between the two shares.
White students showed the reverse pattern: 63.7% of enrollment and 43.0% of the chronically absent population.
Native American students made up 1.7% of enrollment and 4.5% of the chronically absent population.
Hispanic students, at 10.1% of enrollment, accounted for 16.7% of chronic absence. English learners, at 8.4% of enrollment, made up 13.0% of the chronically absent population.
Special education
Special education students had a chronic absenteeism rate of 29.9% and represented 16.7% of statewide enrollment in the same data.
The special education rate was 8.4 percentage points above the all-student rate of 21.5%. The state count included 43,468 chronically absent special education students.
A measurement gap that matters
Minnesota's overall chronic absenteeism rate changed little between 2020-21 and 2023-24, moving from 21.5% to 21.4%. In between, it rose to 26.2% in 2021-22 before declining to 22.2% and then 21.4%. Without subgroup breakdowns for the post-2021 years, the state cannot answer whether those statewide swings reached every group equally.
The 25-point gap documented in 2020-21 is a starting point. Whether it has narrowed in the years since, or changed while the statewide rate returned close to its 2020-21 level, is a question Minnesota's data systems currently cannot answer.
Detailed code that reproduces the analysis and figures in this article is available exclusively to EdTribune subscribers.
Discussion
Sign in to join the discussion.
Loading comments...