In this series: Minnesota 2025-26 Enrollment.
Correction (July 23, 2026): An earlier version said the kindergarten-to-senior ratio had fallen in 10 of the past 12 years with only a 2020 bounce. It fell in 9 of 12 years, with upticks in 2018, 2020, and 2022.
Minnesota's public school system set four grade-level records simultaneously in 2025-26. Pre-K enrollment hit an all-time high of 29,888 students. Grade 12 also reached an all-time high of 76,674. Kindergarten fell to an all-time low of 56,993. And first grade joined it at the bottom, also touching a 20-year low of 58,699.
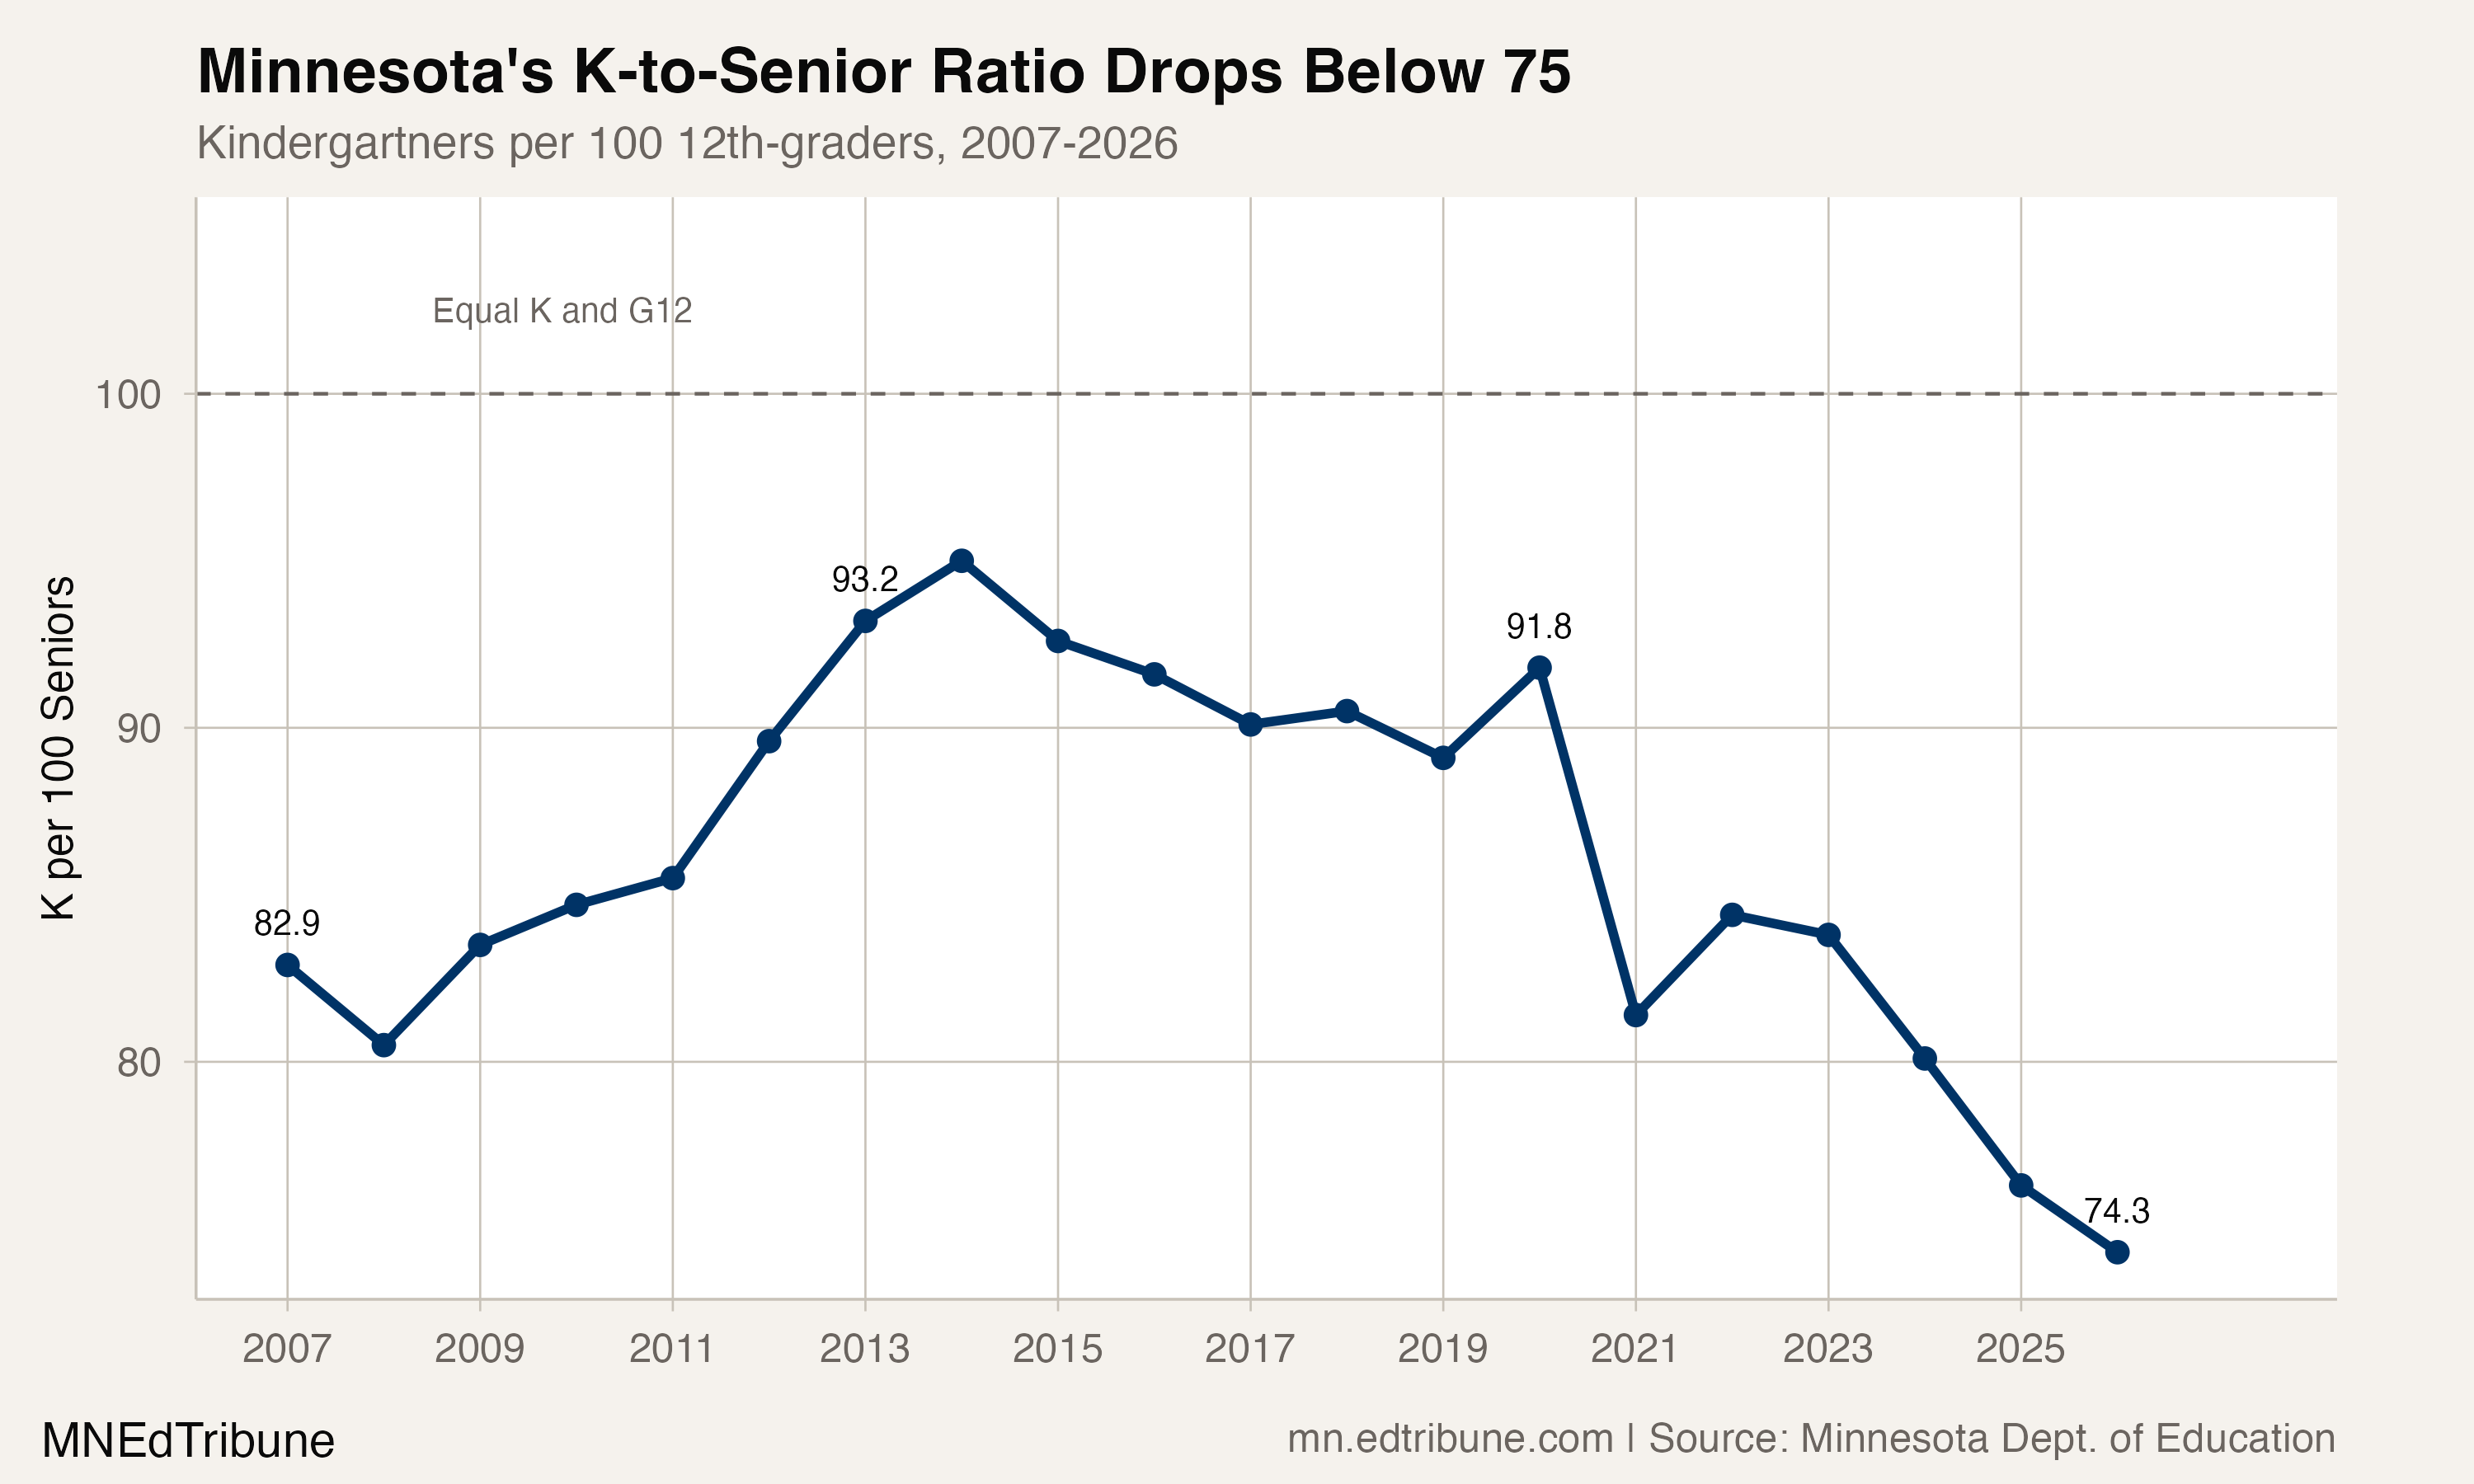
The result: for every 100 seniors preparing to graduate, Minnesota has just 74 kindergartners entering the pipeline behind them. That ratio, 74.3, is the lowest in at least two decades. It was 82.9 in 2007 and nearly reached parity at 95.0 in 2014 before beginning its current collapse.
The shape of a system inverting
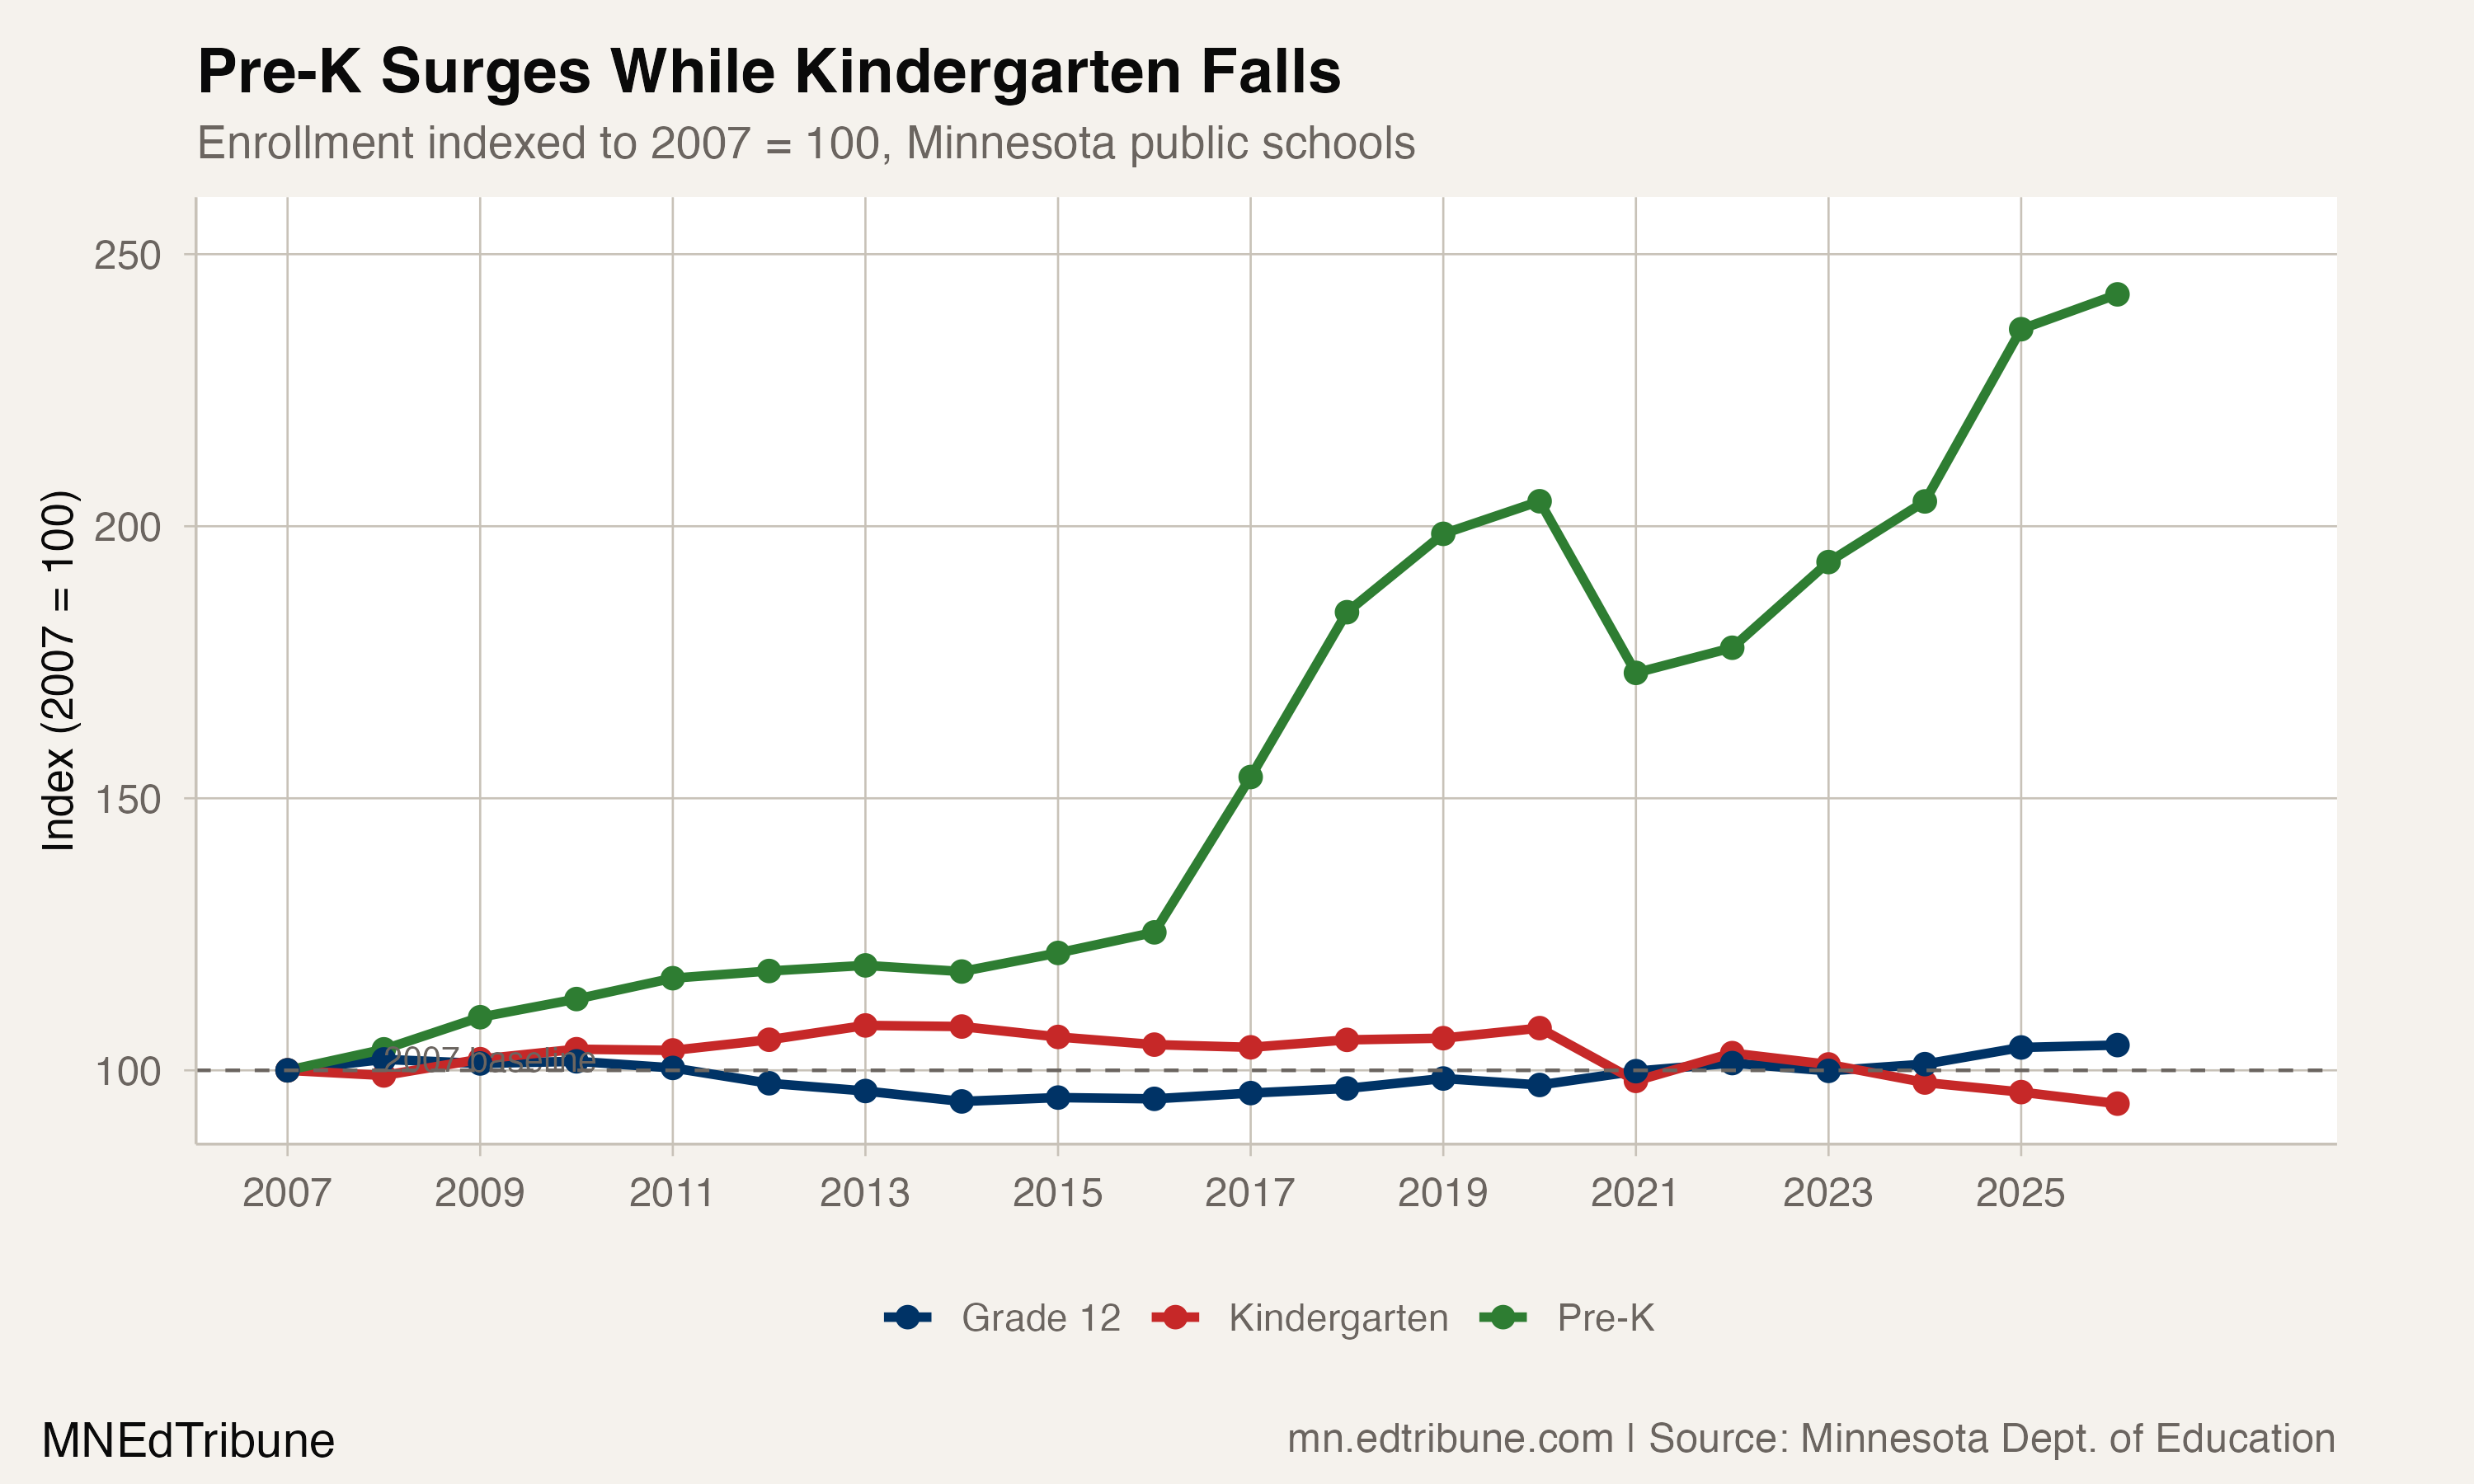
The grade profile chart tells the story more clearly than any single number. In 2007, Minnesota's enrollment formed a pyramid: smaller elementary grades feeding into larger upper grades, with 12th grade as the widest band. By 2026, the pyramid has inverted at both ends. Pre-K enrollment has grown 142.6% since 2007, from 12,319 to 29,888. Kindergarten has fallen 6.1%, from 60,712 to 56,993. The middle grades are roughly stable. And 12th grade has grown 4.6%, from 73,273 to 76,674.
The K-to-senior ratio captures the structural shift in a single metric. From 2007 to 2014, the ratio climbed steadily, peaking at 95.0 as kindergarten enrollment grew and senior classes shrank slightly. Since then it has fallen in 9 of 12 years, with brief upticks in 2018, 2020, and 2022. The last three years have been the steepest decline on record: 83.8 in 2023, 80.1 in 2024, 76.3 in 2025, and 74.3 in 2026.
Where the kindergartners went
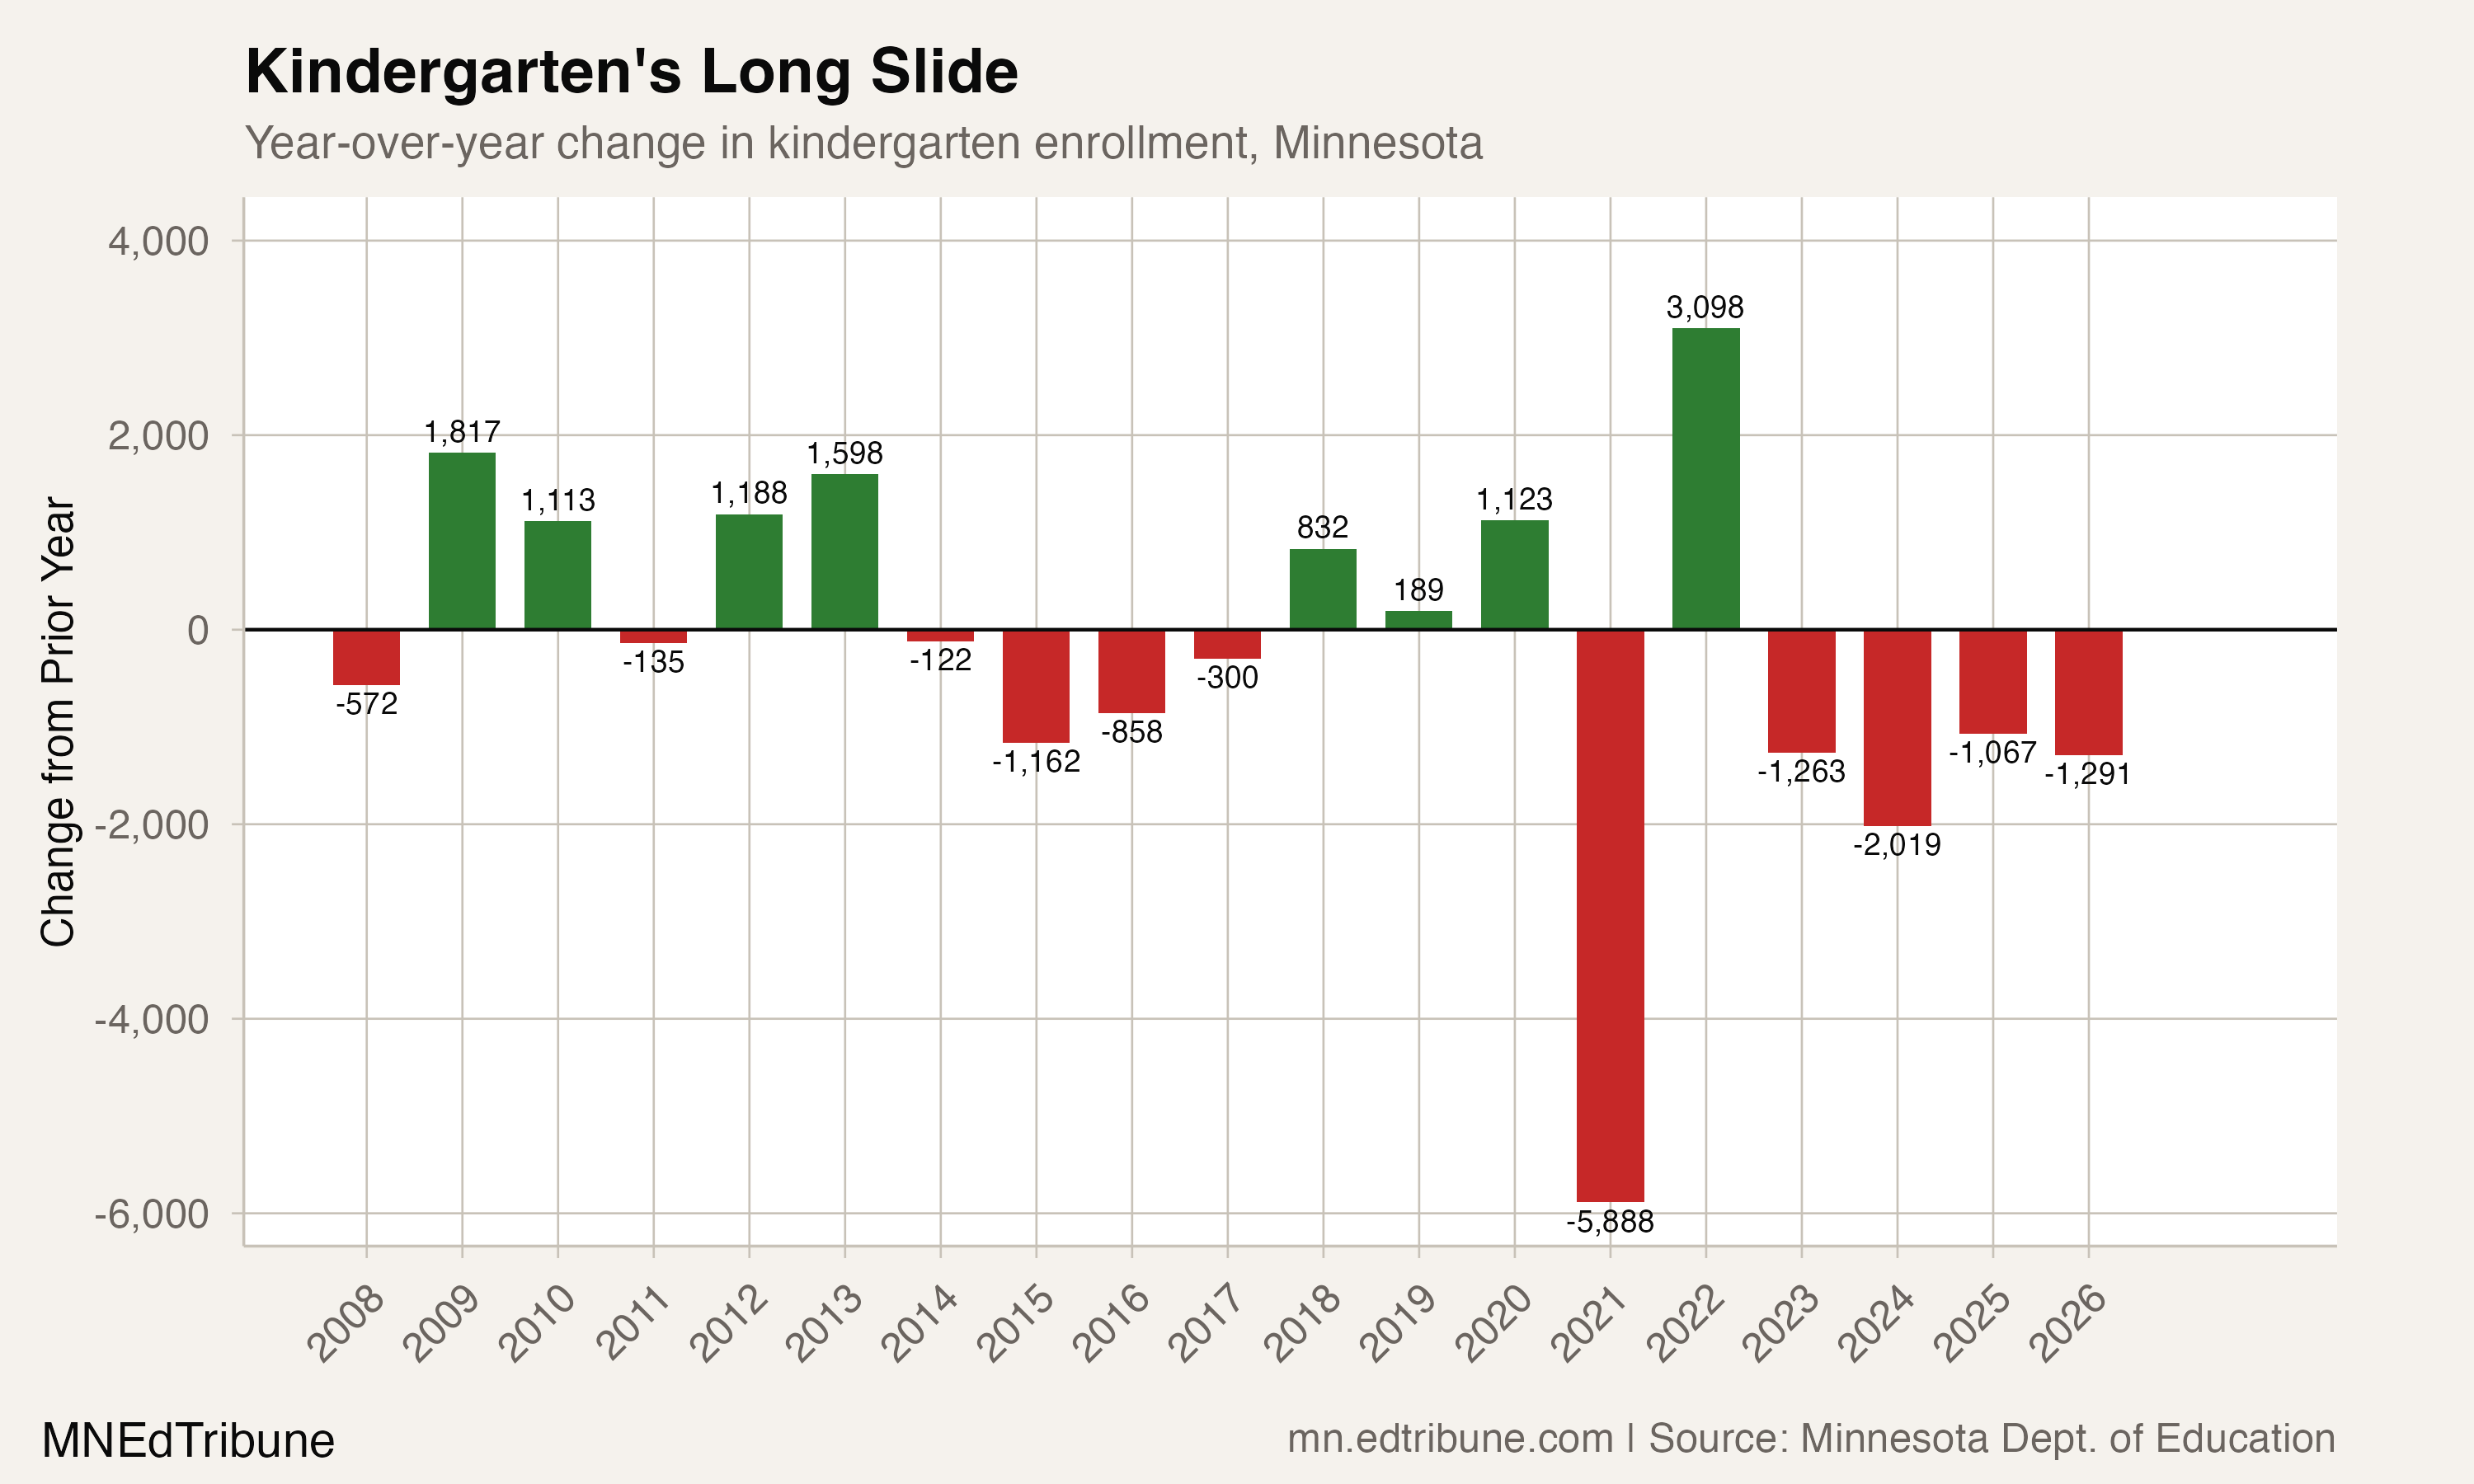
Kindergarten's slide did not happen all at once. From 2008 to 2020, K enrollment oscillated between 59,500 and 65,700, gaining and losing small numbers each year. COVID dropped it by 5,888 in a single year, from 65,423 to 59,535. The partial rebound of 2022 (+3,098) proved temporary. Since then, kindergarten has lost students in four consecutive years, falling by 1,263, then 2,019, then 1,067, and then 1,291.
The most likely driver is straightforward: fewer children are being born in Minnesota. The state has not reached replacement-level fertility since 2006, and the decline has accelerated. Using 2014 as a baseline, Minnesota has accumulated over 34,000 "missing" births over a decade, with 2,344 fewer births between 2022 and 2023 alone. Children born during the lowest-birth-rate years are now reaching kindergarten age.
Rochester offers a local case study. Despite adding 14,626 residents between 2010 and 2020, the school district has watched kindergarten enrollment drop as the share of population under age five fell from 7.2% to an estimated 5.6%. District spokesperson Mamisoa Knutson attributed it directly:
"A decline in local birth rates has directly caused kindergarten enrollment to drop by nearly 15%." -- Post Bulletin, Rochester
A secondary factor: families are choosing alternatives. Rochester alone lost 2,863 students to open enrollment, charter schools, and homeschooling in 2024-25, up from 1,741 a decade earlier.
Pre-K expansion is not feeding kindergarten
The most striking feature of the data is what is not happening. Pre-K enrollment has grown from 12,319 to 29,888 since 2007. If this expansion were feeding kindergarten, K enrollment should be rising. Instead, K is falling.
The PK-to-K conversion ratio makes this visible. In 2008, there were 488 kindergartners for every 100 pre-K students the year before. By 2020, that had fallen to 267. In 2026, it hit 196. There are now barely two kindergartners for every pre-K student from the prior year, down from nearly five-to-one two decades ago.
This does not mean pre-K is failing. It means pre-K expansion is capturing children who were already going to attend kindergarten, not generating new kindergartners. The Legislature's expansion of Voluntary Prekindergarten to 12,360 funded seats with $38 million in new funding has successfully brought four-year-olds into the public system a year earlier. But it cannot create children who were never born.
Minnesota currently ranks 37th nationally in pre-K enrollment, serving just 11% of four-year-olds in state-funded programs. The gap between pre-K's growth trajectory and kindergarten's decline will likely widen as the state continues expanding access.
The 6,500 extra seniors
Grade 12's all-time high is not entirely what it seems. In every year since at least 2008, Minnesota has counted more 12th-graders than it counted 11th-graders the year before. In 2026, the state enrolled 76,674 seniors after recording 70,128 juniors in 2025, a progression rate of 109.3%. That gap represents 6,546 students who appear in 12th grade without a matching 11th-grade record from the prior year.
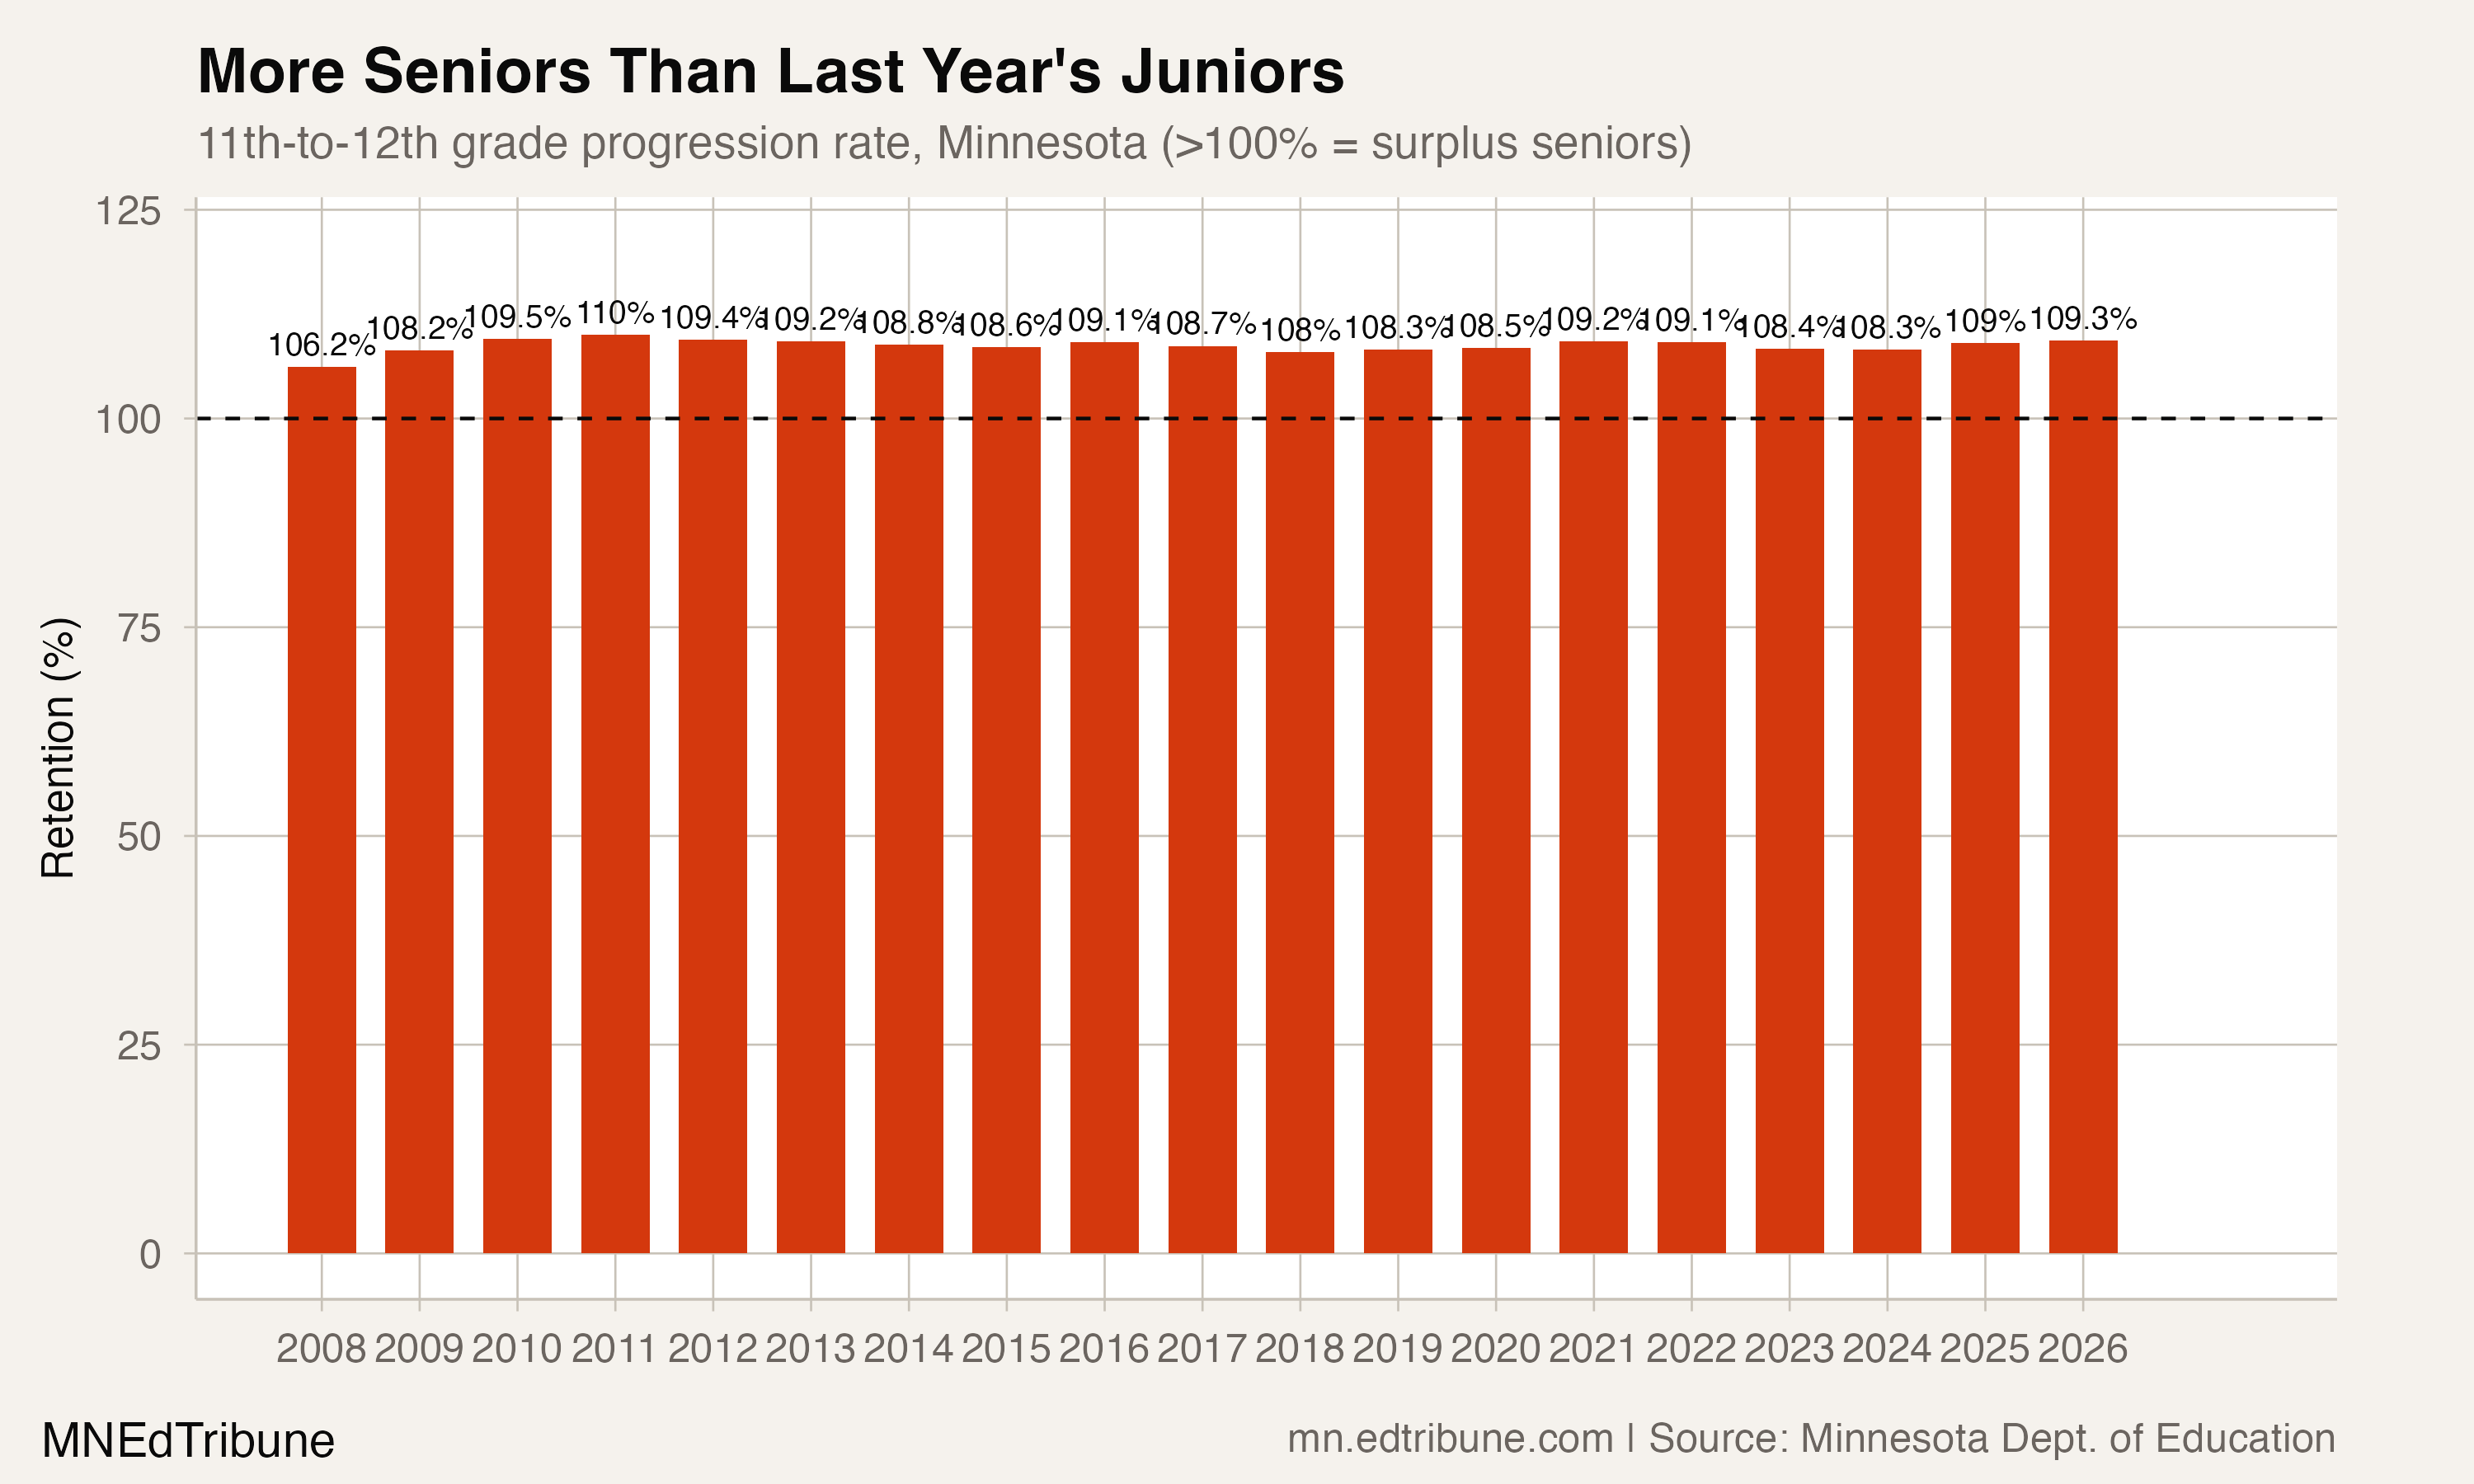
This is a persistent structural pattern, not a 2026 anomaly. The 11th-to-12th progression rate has exceeded 106% in every year on record, averaging roughly 108-109%. Several mechanisms likely contribute: students returning from alternative programs or homeschooling to graduate with their class, transfer students entering from out of state, and students taking five or more years to complete high school. Minnesota tracks seven-year adjusted cohort graduation rates alongside four-year rates, acknowledging that many students need additional time.
The state's four-year graduation rate hit a record 84.2% in 2024, meaning roughly 16% of each cohort does not finish on the standard timeline. Some portion of those students eventually return, inflating the 12th-grade count in later years.
What this means for budgets and buildings
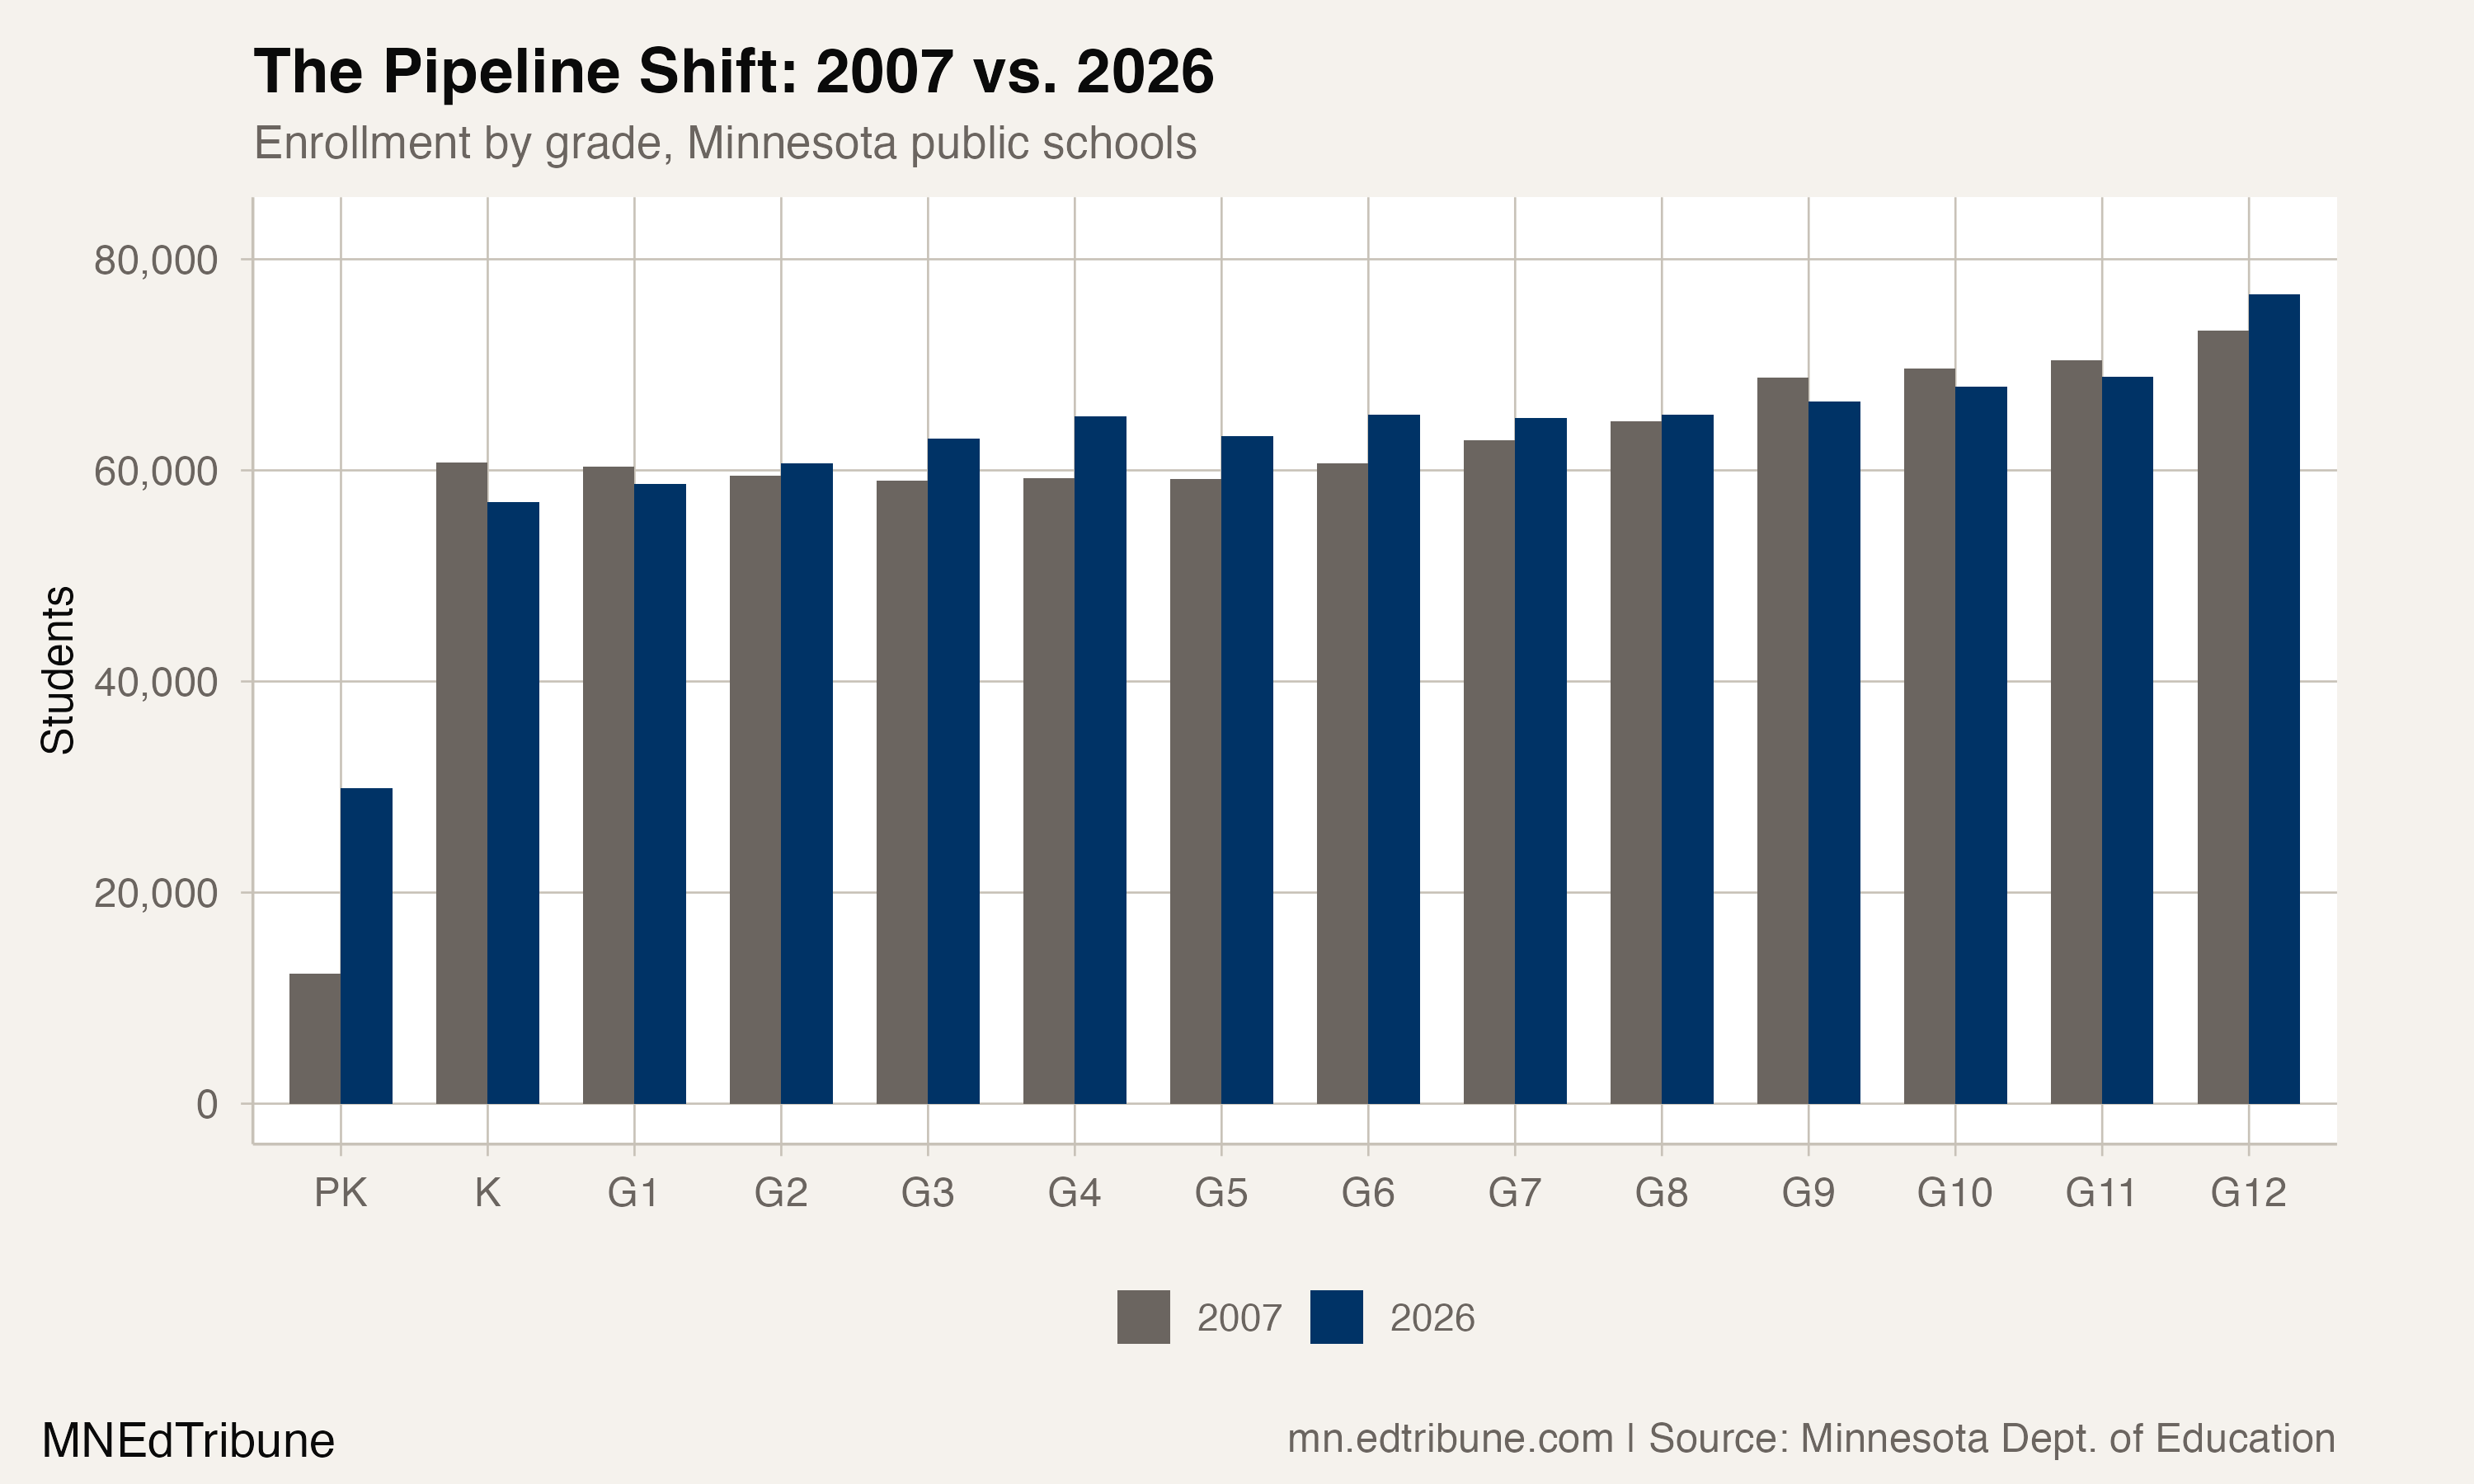
The pipeline chart above shows the fundamental budget problem. In 2007, Minnesota's grade distribution was top-heavy: upper grades had more students than lower grades. In 2026, the top is even heavier while the bottom has thinned further. Each cohort currently moving through elementary school is smaller than the one ahead of it.
Minnesota's per-pupil formula is set at $7,481 for the current fiscal year, with a 2% annual floor increase. Declining enrollment revenue is forecasted at $31 million for FY 2026, and districts that lose students receive a partial buffer of 28% of the basic formula allowance per lost pupil. But that buffer is temporary. When kindergarten classes of 57,000 replace graduating classes of 77,000, the arithmetic is inescapable: the system will serve roughly 20,000 fewer students per cohort within a decade.
Minnesota's birth data already contains the answer for the next five years, and the math is not ambiguous. The children who will enter kindergarten in fall 2027 were born in 2022, when Minnesota recorded its lowest birth total in decades. The 2023 cohort was smaller still. Each of those classes will be smaller than the 56,993 kindergartners enrolled today, and each will eventually replace a 12th-grade class of 76,000 or more. By 2032, the system will be cycling roughly 20,000 fewer students per cohort through its buildings. That decline is not a forecast. It is a countdown, and the clock started years ago.
Detailed code that reproduces the analysis and figures in this article is available exclusively to EdTribune subscribers.
Discussion
Sign in to join the discussion.
Loading comments...