In this series: Minnesota 2025-26 Enrollment.
Minnesota's total K-12 enrollment is higher today than it was in 2007. The state enrolled 873,175 students in 2025-26, up 32,613 from the 840,562 it counted 19 years earlier.
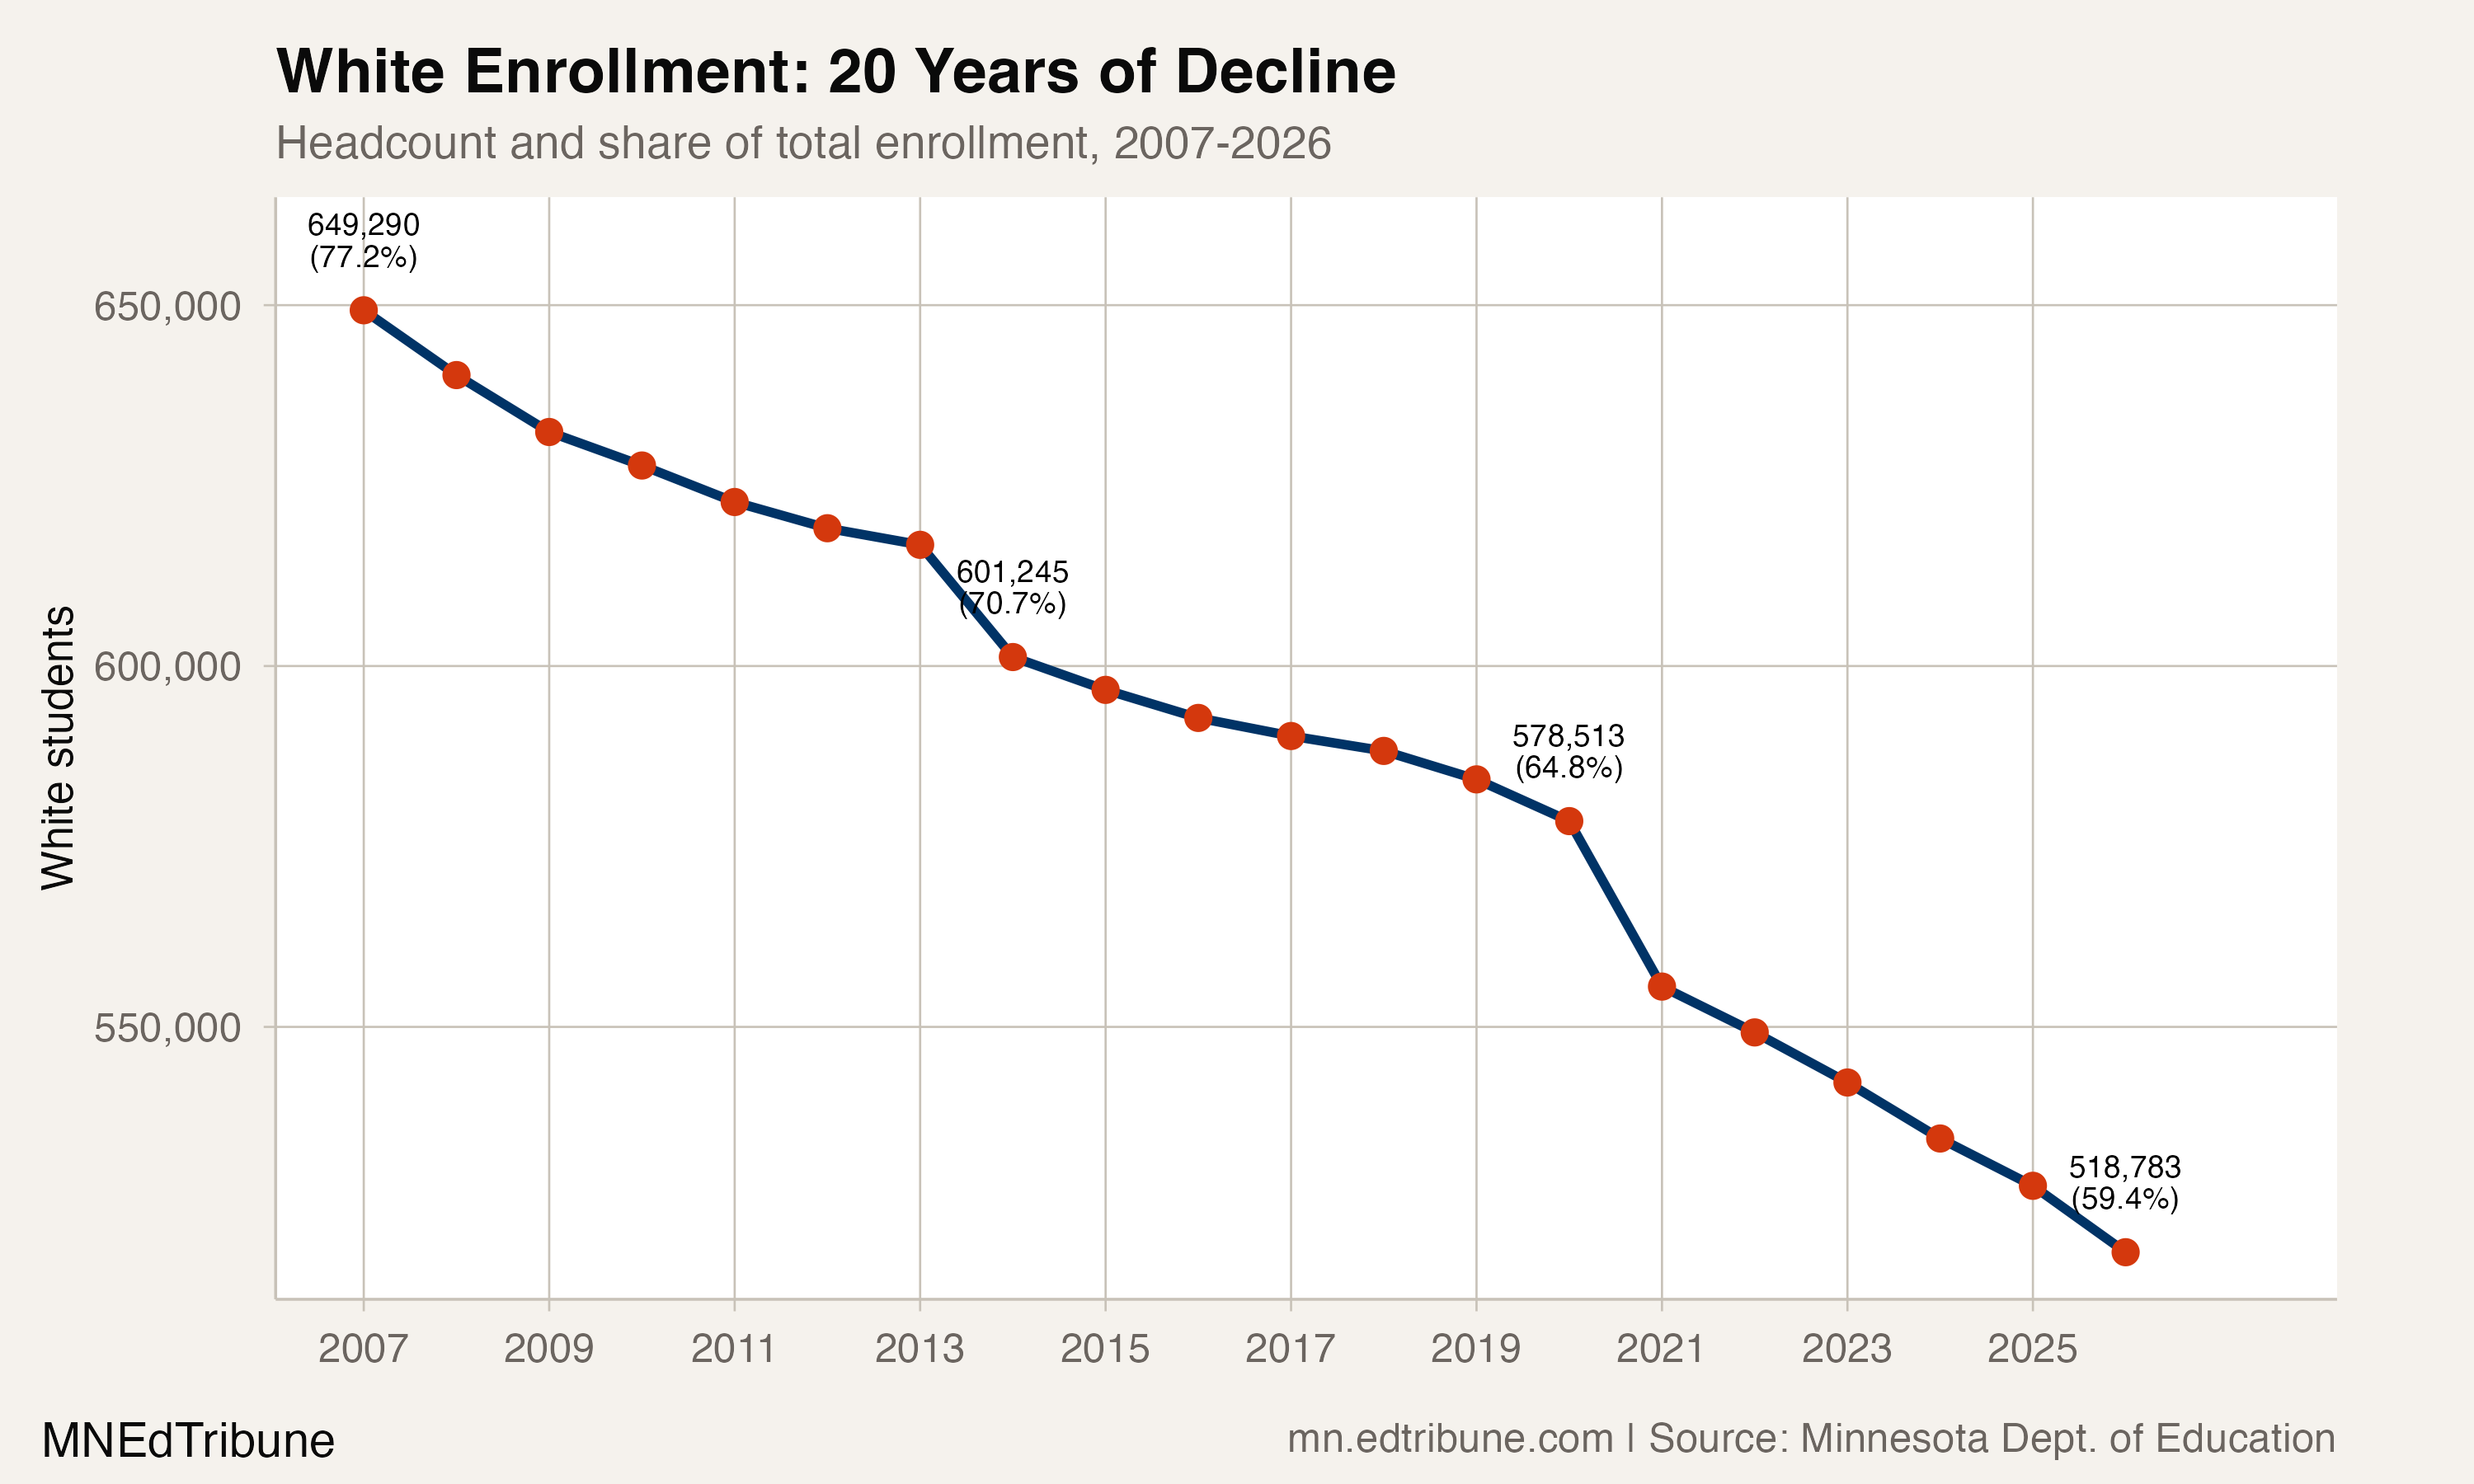
That growth masks a near-total demographic replacement. Over the same period, white enrollment fell from 649,290 to 518,783, a loss of 130,507 students, or 20.1%. The decline has never once reversed. Not for a single year. White enrollment fell every year from 2008 through 2026, a 19-year unbroken streak that predates the pandemic, predates the state's charter expansion, and predates any policy change in the dataset.
Remove white students from the ledger, and Minnesota's enrollment grew by more than 163,000.
The arithmetic of who's replacing whom
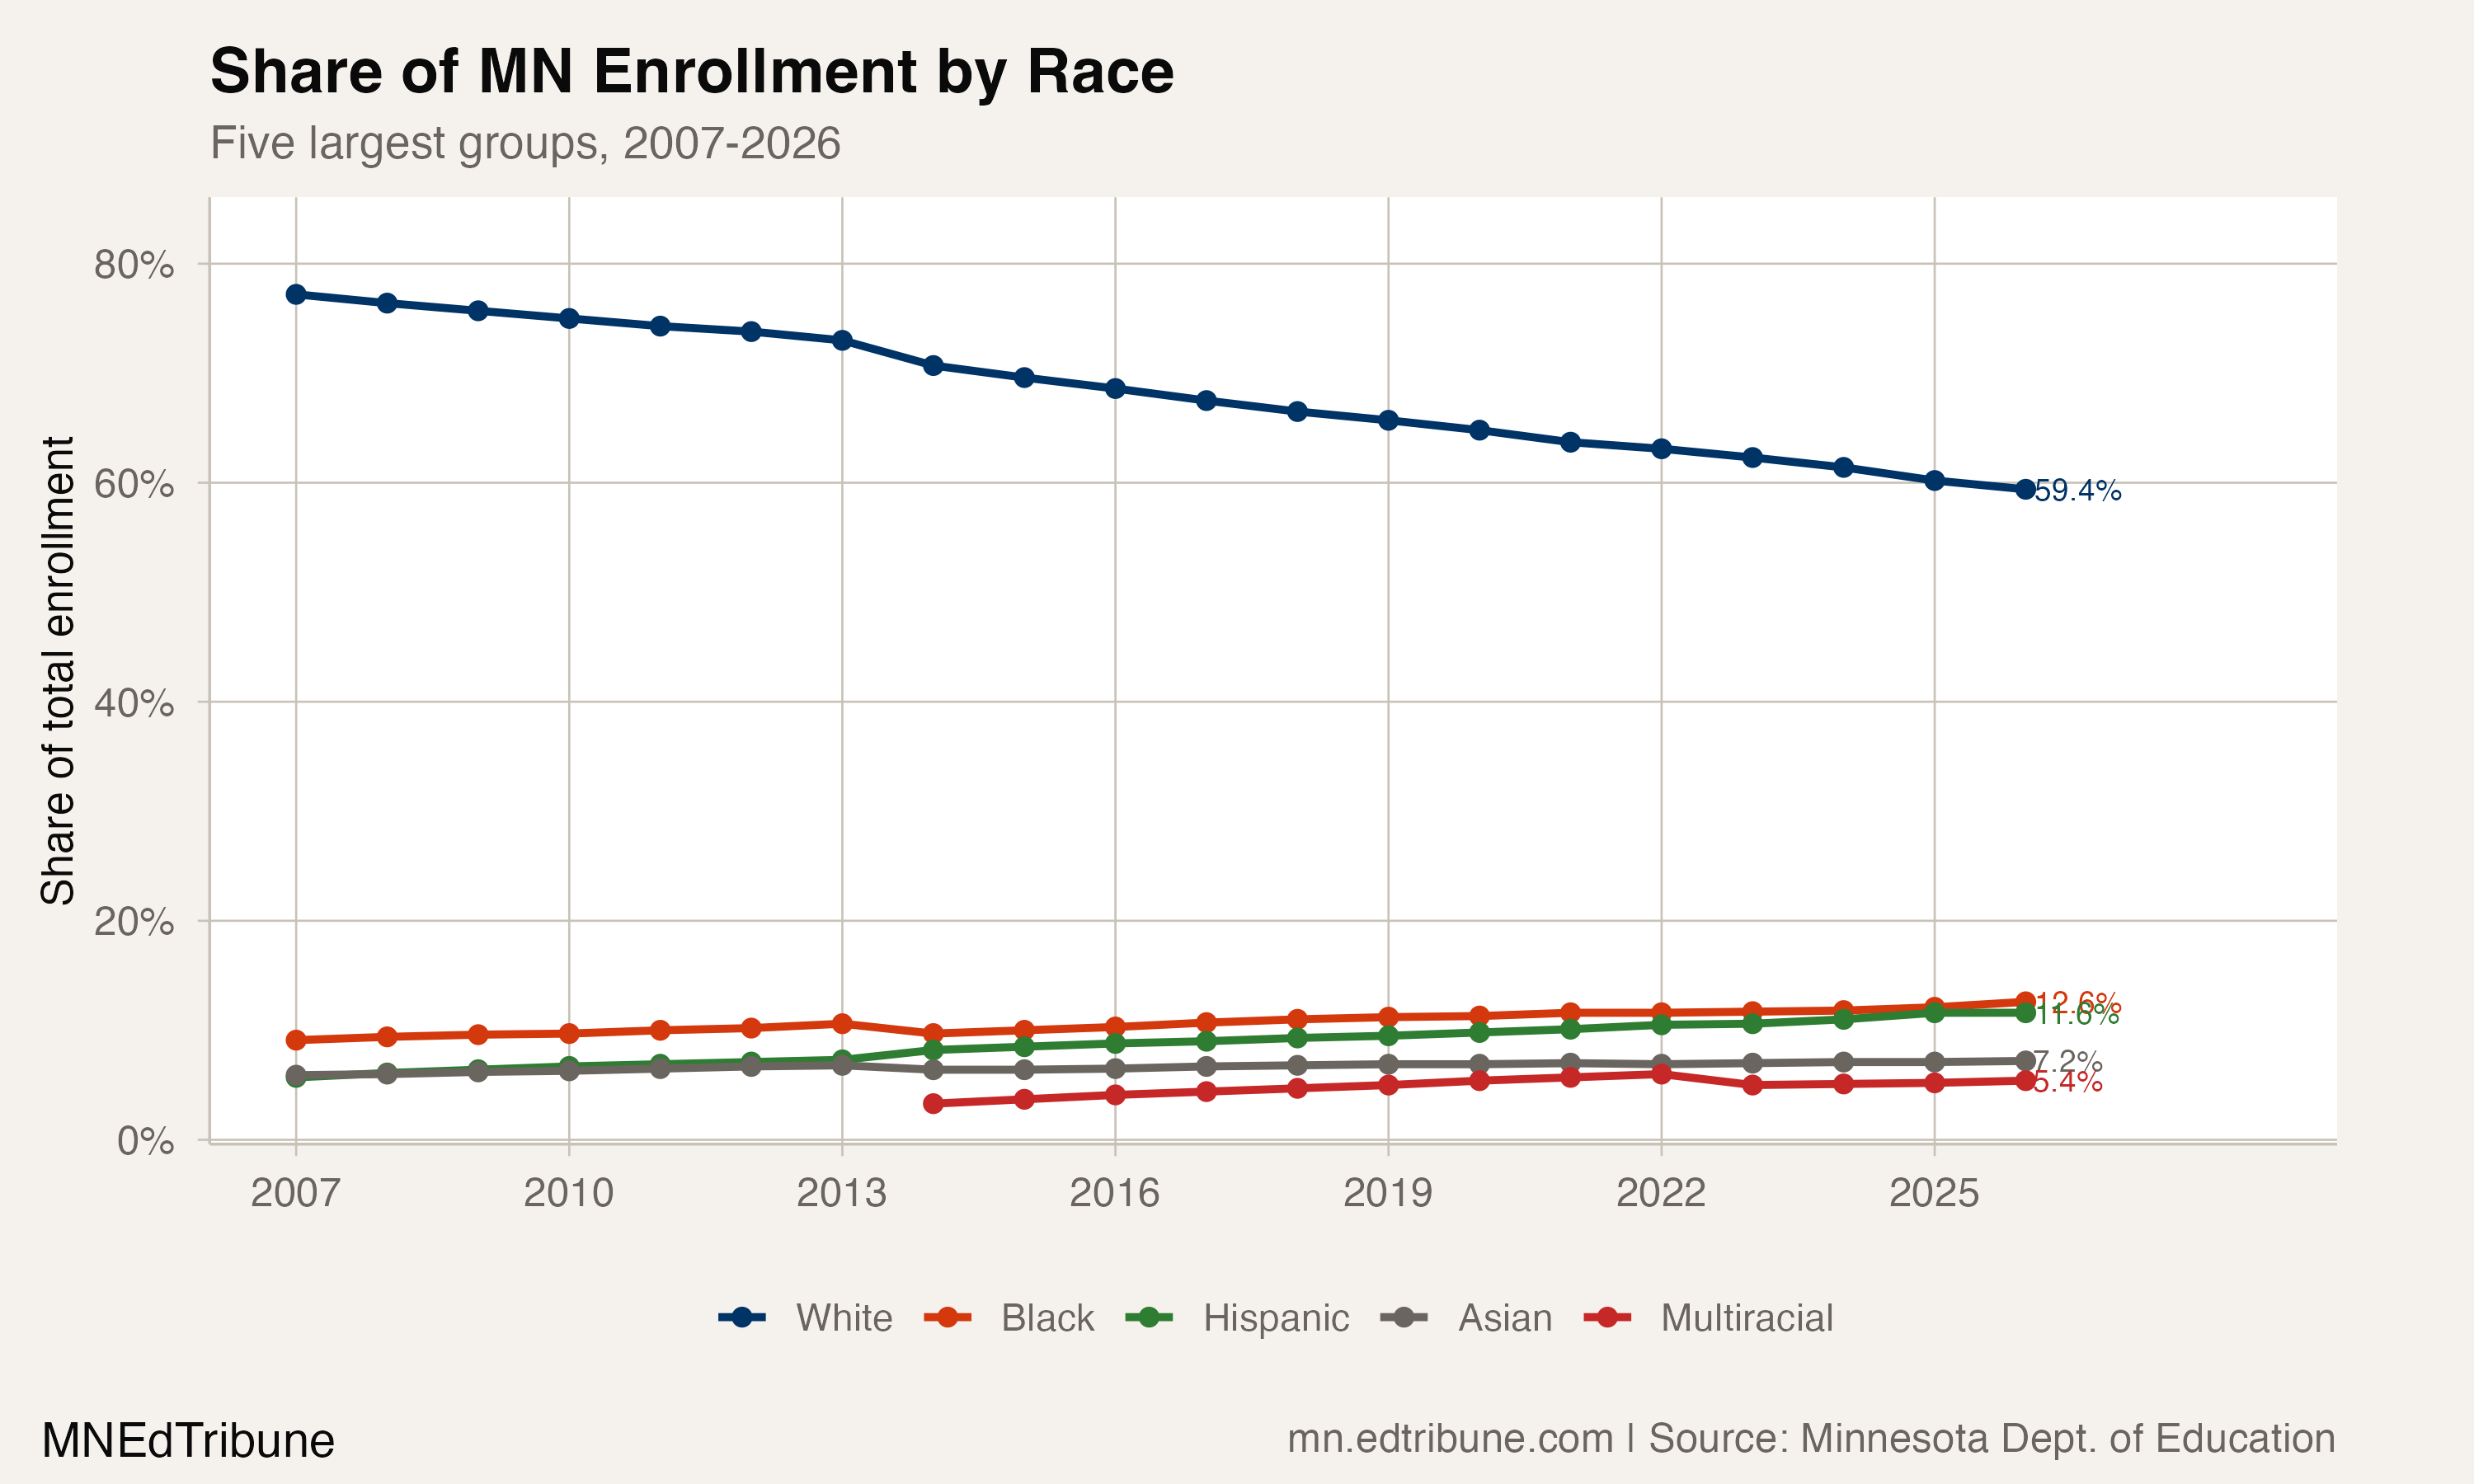
The racial composition of Minnesota schools has shifted more in two decades than many states manage in a generation. White students made up 77.2% of enrollment in 2007. By 2026, that share had fallen to 59.4%, a decline of 0.94 percentage points per year. At that pace, Minnesota crosses the majority-minority threshold around 2036.
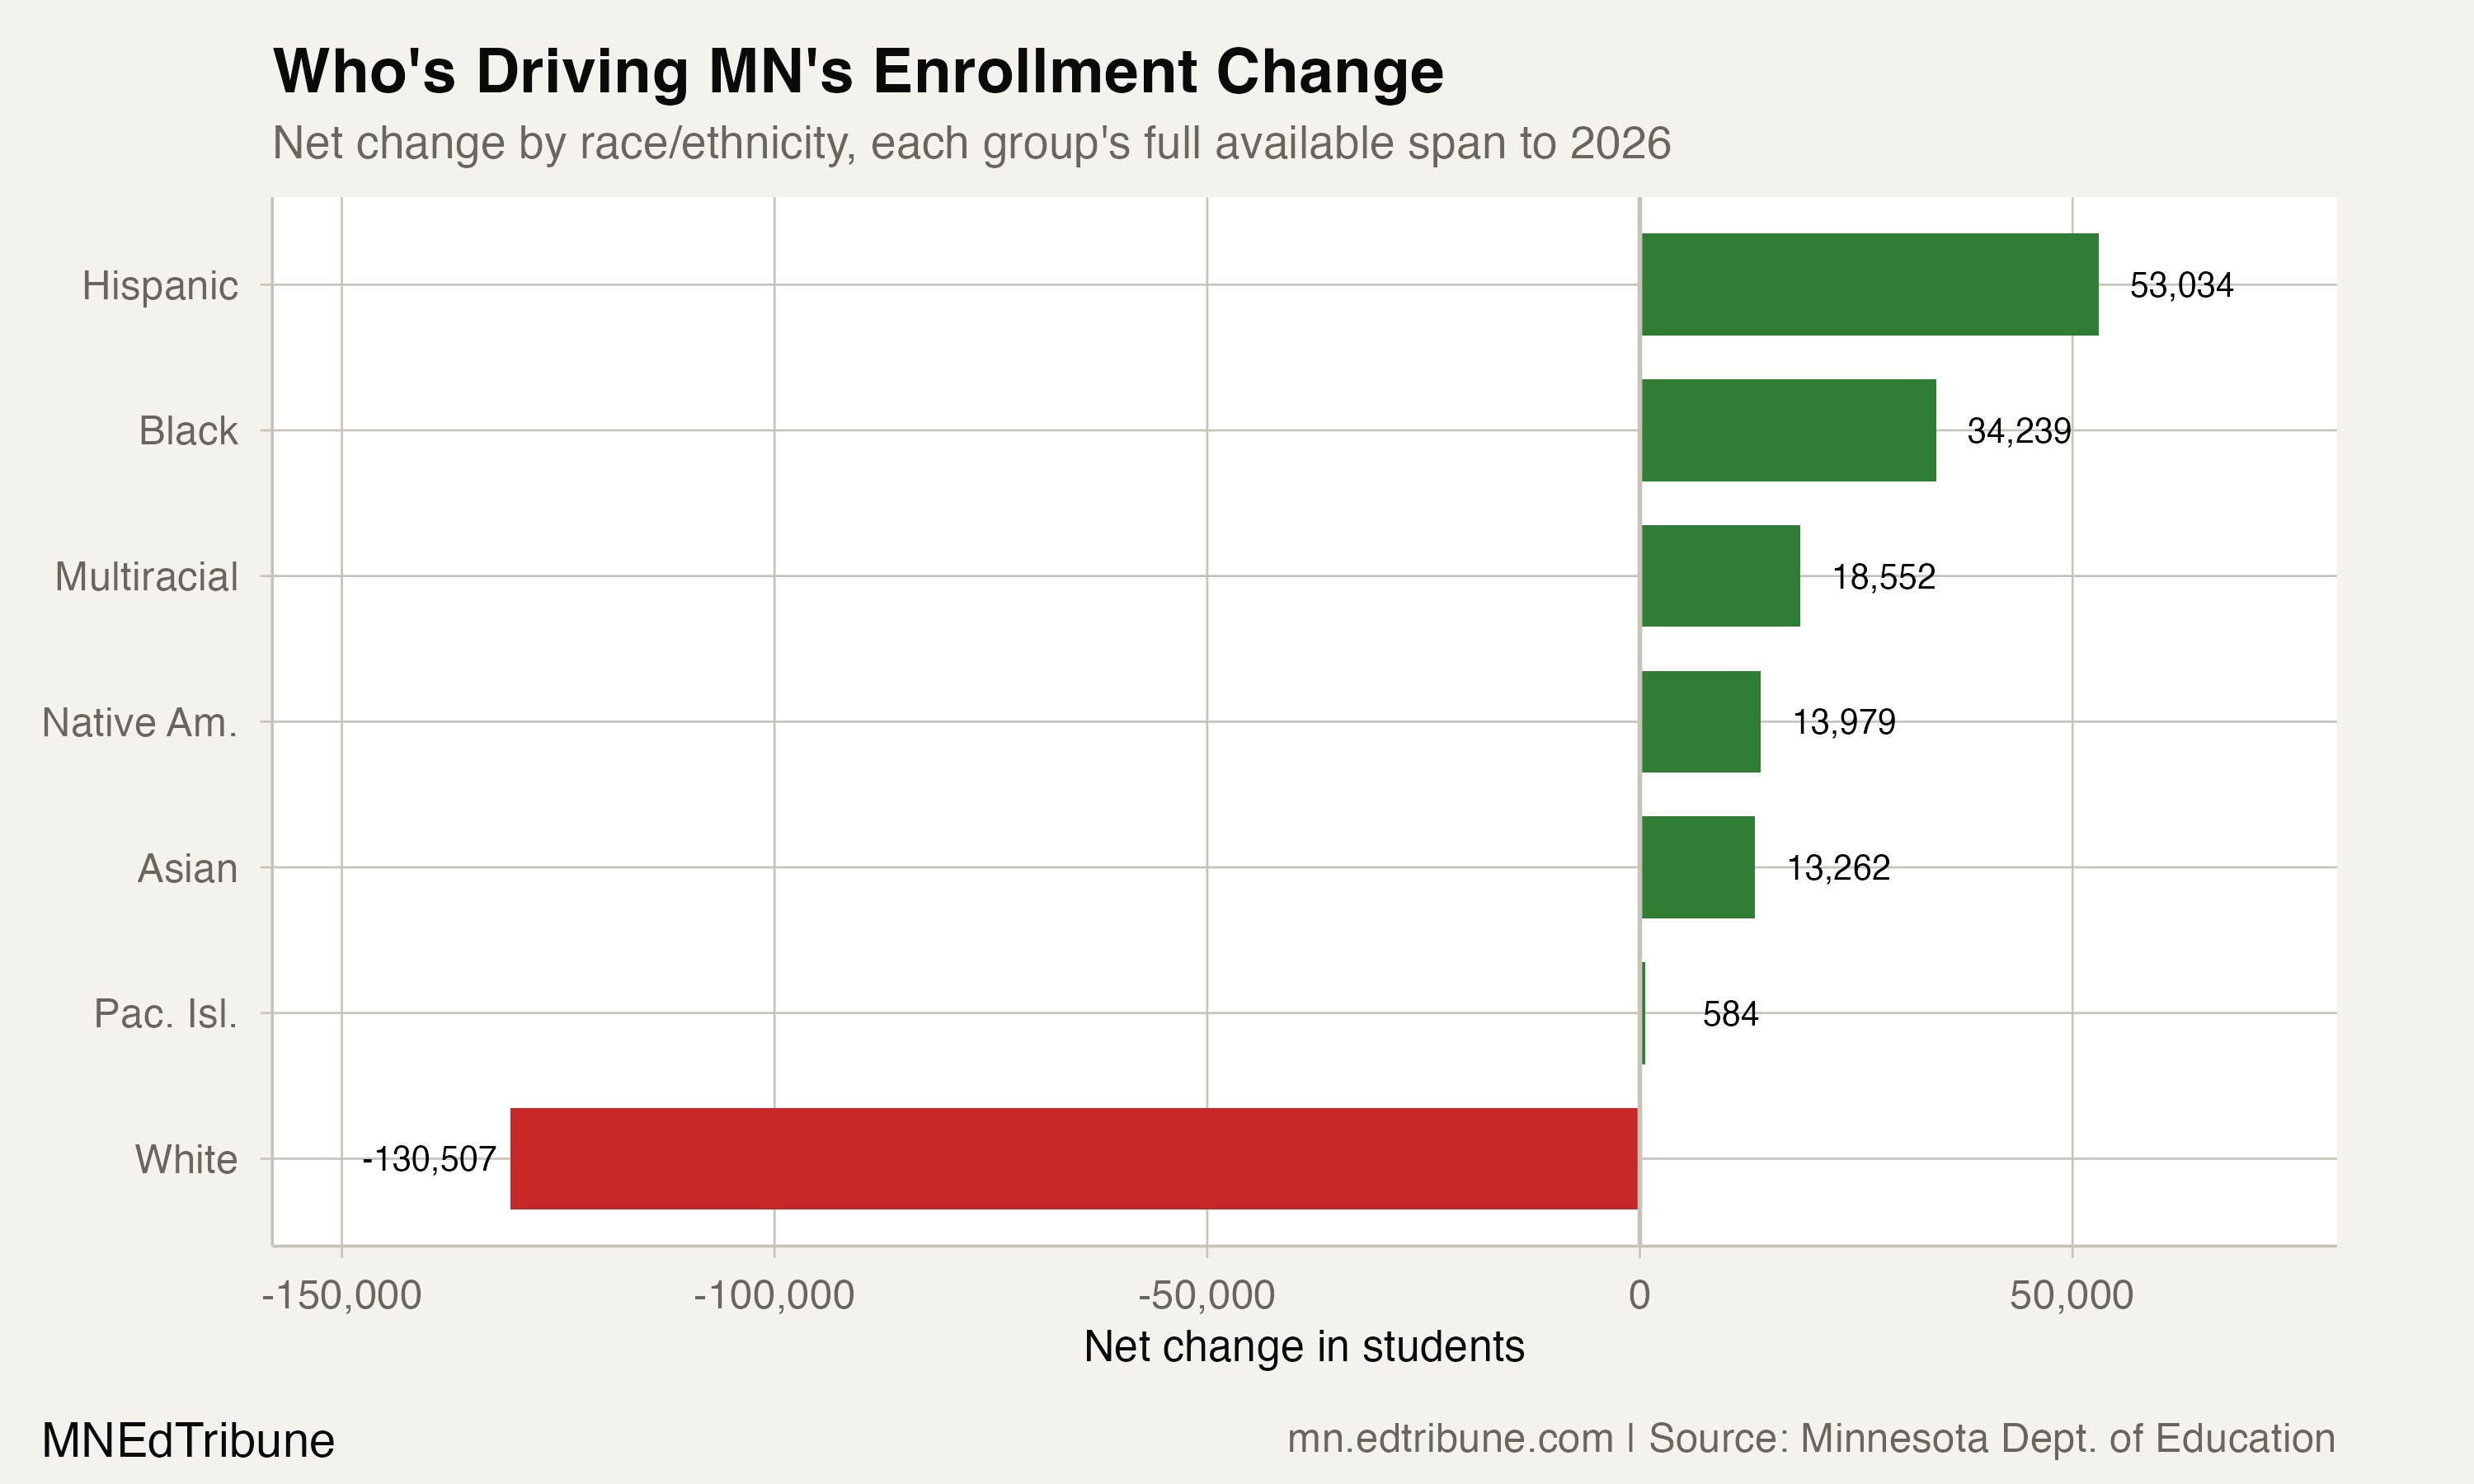
Every other racial group grew over the same span. Hispanic enrollment more than doubled, rising from 48,269 to 101,303 (+109.9%). Black enrollment grew 45.0%, from 76,073 to 110,312. Asian enrollment rose 26.9% to 62,538. Multiracial students, tracked only since 2014, grew 65.7% to 46,777.
The combined effect is stark. White students account for a loss of 130,507, while the state's total enrollment grew by 32,613. White decline did not merely drive Minnesota's enrollment pressure. It exceeded it. If white enrollment had held steady at 2007 levels, Minnesota would be enrolling over 1 million students today.
Birth rates set the floor
The most direct driver of white enrollment decline is the one school districts can do the least about: fewer white babies. Minnesota's overall birth rate has fallen steadily, from roughly 73,000 births in 2007 to about 61,000 by 2023. The decline is concentrated among white families.
State demographer Megan Dayton told Twin Cities Business that the white non-Hispanic population in Minnesota "has a very low fertility rate having the fewest babies of any race group in Minnesota," and that "births in the last 30 years have increasingly been ticking down every single year for white non-Hispanic mothers."
"Any growth that we did see in the past has come from people of color." Megan Dayton, Minnesota State Demographic Center, via Twin Cities Business
As of the 2021-2023 average, white non-Hispanic births account for 66.4% of Minnesota births, while white residents make up about 78% of the state's total population. The gap between birth share and population share means the demographic shift visible in schools today is still accelerating.
The suburban ring, not the cities, is the epicenter
The geography of white enrollment decline confounds expectations. The largest absolute losses are not in Minneapolis or Saint Paul. They are in the inner-ring suburbs that were overwhelmingly white a generation ago and are now among the most diverse districts in the state.
Anoka-Hennepin↗ET, the state's largest district, lost 13,255 white students since 2007, falling from 33,775 to 20,520. Its white share dropped from 81.8% to 53.5%. Burnsville-Eagan-Savage↗ET went from 69.1% white to 26.1%, losing 5,349 of its 7,319 white students, a 73.1% decline. Robbinsdale↗ET lost 4,281 white students and dropped from 57.8% to 32.5% white.
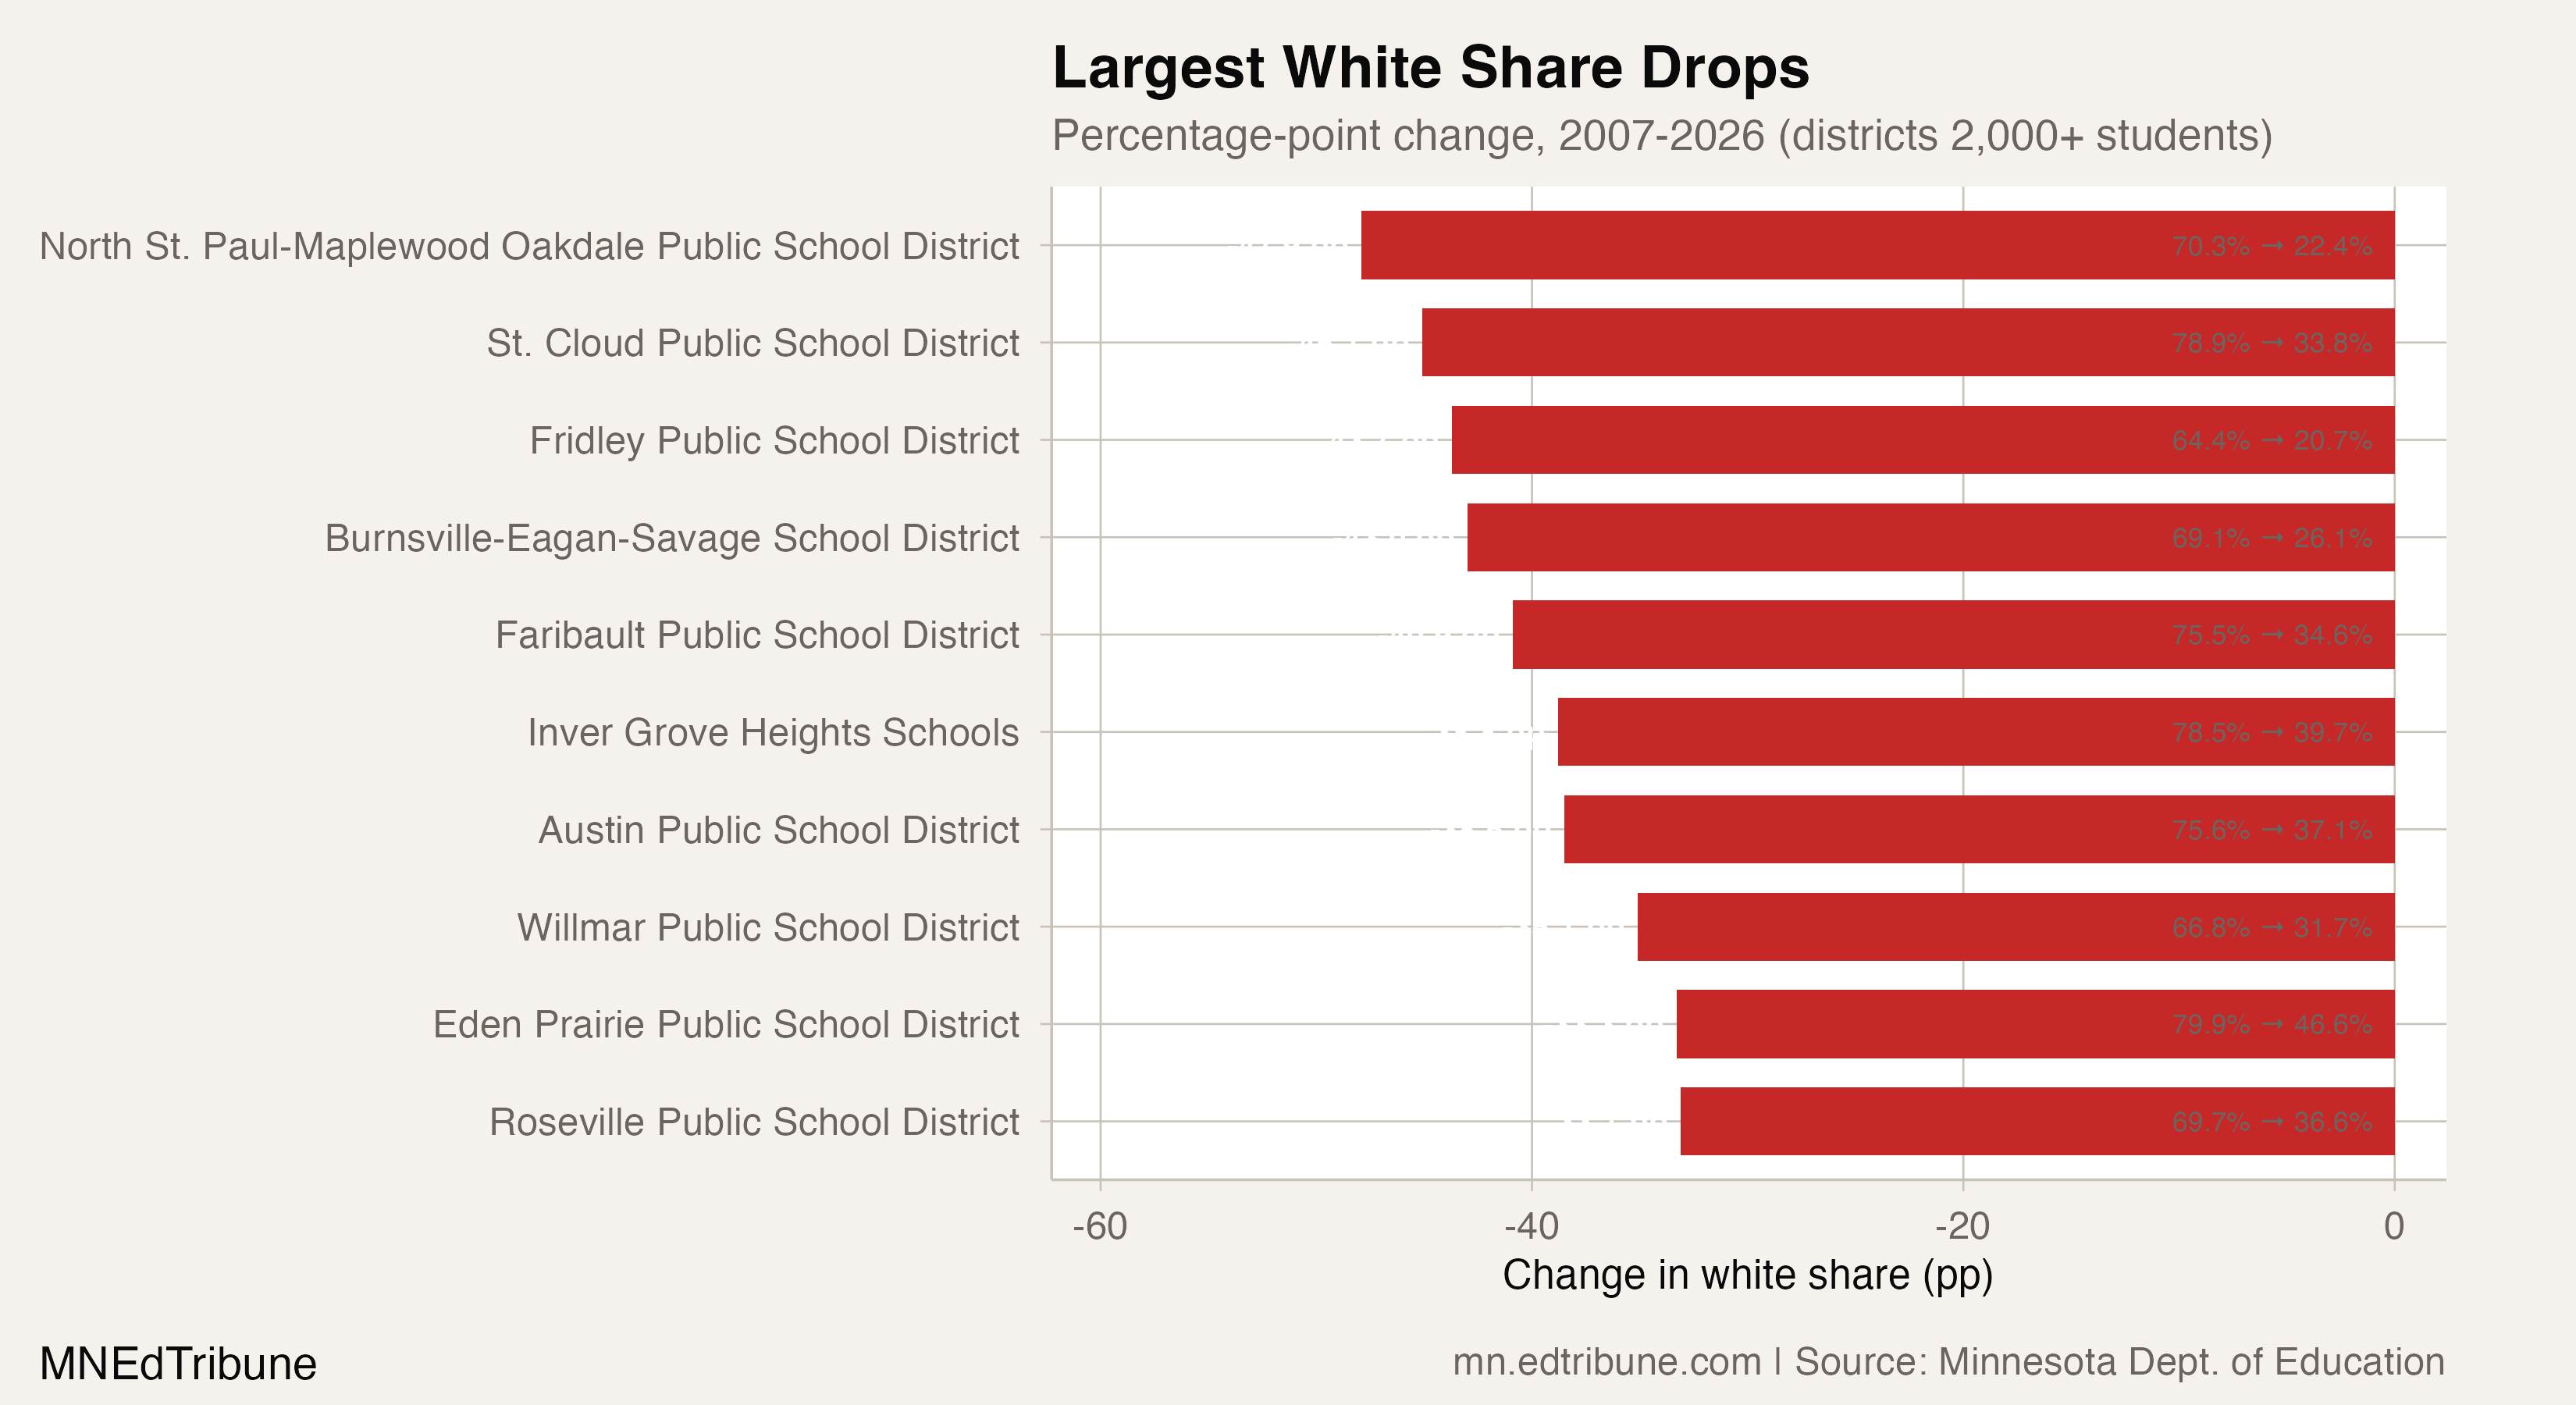
The share drops in some of these districts are staggering. North St. Paul-Maplewood Oakdale↗ET fell from 70.3% white to 22.4%, a 47.9 percentage-point shift. St. Cloud↗ET went from 78.9% white to 33.8%, reflecting the growth of its large Somali community. Fridley dropped from 64.4% to 20.7%.
These shifts reflect at least two overlapping forces: white families aging out or moving to exurban districts, and immigrant and refugee families concentrating in inner-ring suburbs where housing is more affordable than in the outer ring.
The Association of Metropolitan School Districts reported in 2025 that nearly 11% of Minnesota students were identified as English learners in 2024-25, an increase of more than 7,000 students in a single year, bringing the total to more than 91,000. Several of the districts with the largest white share drops, including Columbia Heights (48.3% EL), St. Cloud, and Burnsville, are among those with the highest EL concentrations.
The Twin Cities paradox
Minneapolis↗ET is one of the few large districts where white enrollment has held relatively steady in absolute terms, fluctuating around 10,500-12,500. But the district's trajectory tells a different story about what "white decline" means. Because Minneapolis lost so many students overall (37,033 to 30,079), white students actually grew as a share of enrollment, from 28.5% to 36.4%.
Black enrollment in Minneapolis, meanwhile, dropped from 41.3% to 26.8%. The state's largest, most diverse urban district is becoming proportionally whiter, not because white families are arriving, but because Black families are leaving faster.
COVID acceleration and the 2026 cliff
White enrollment has declined every year, but the rate has not been constant. The pre-pandemic period averaged annual losses of roughly 5,000-6,000 white students. Then COVID hit: the 2021 school year saw a single-year drop of 22,927 white students, by far the largest on record.
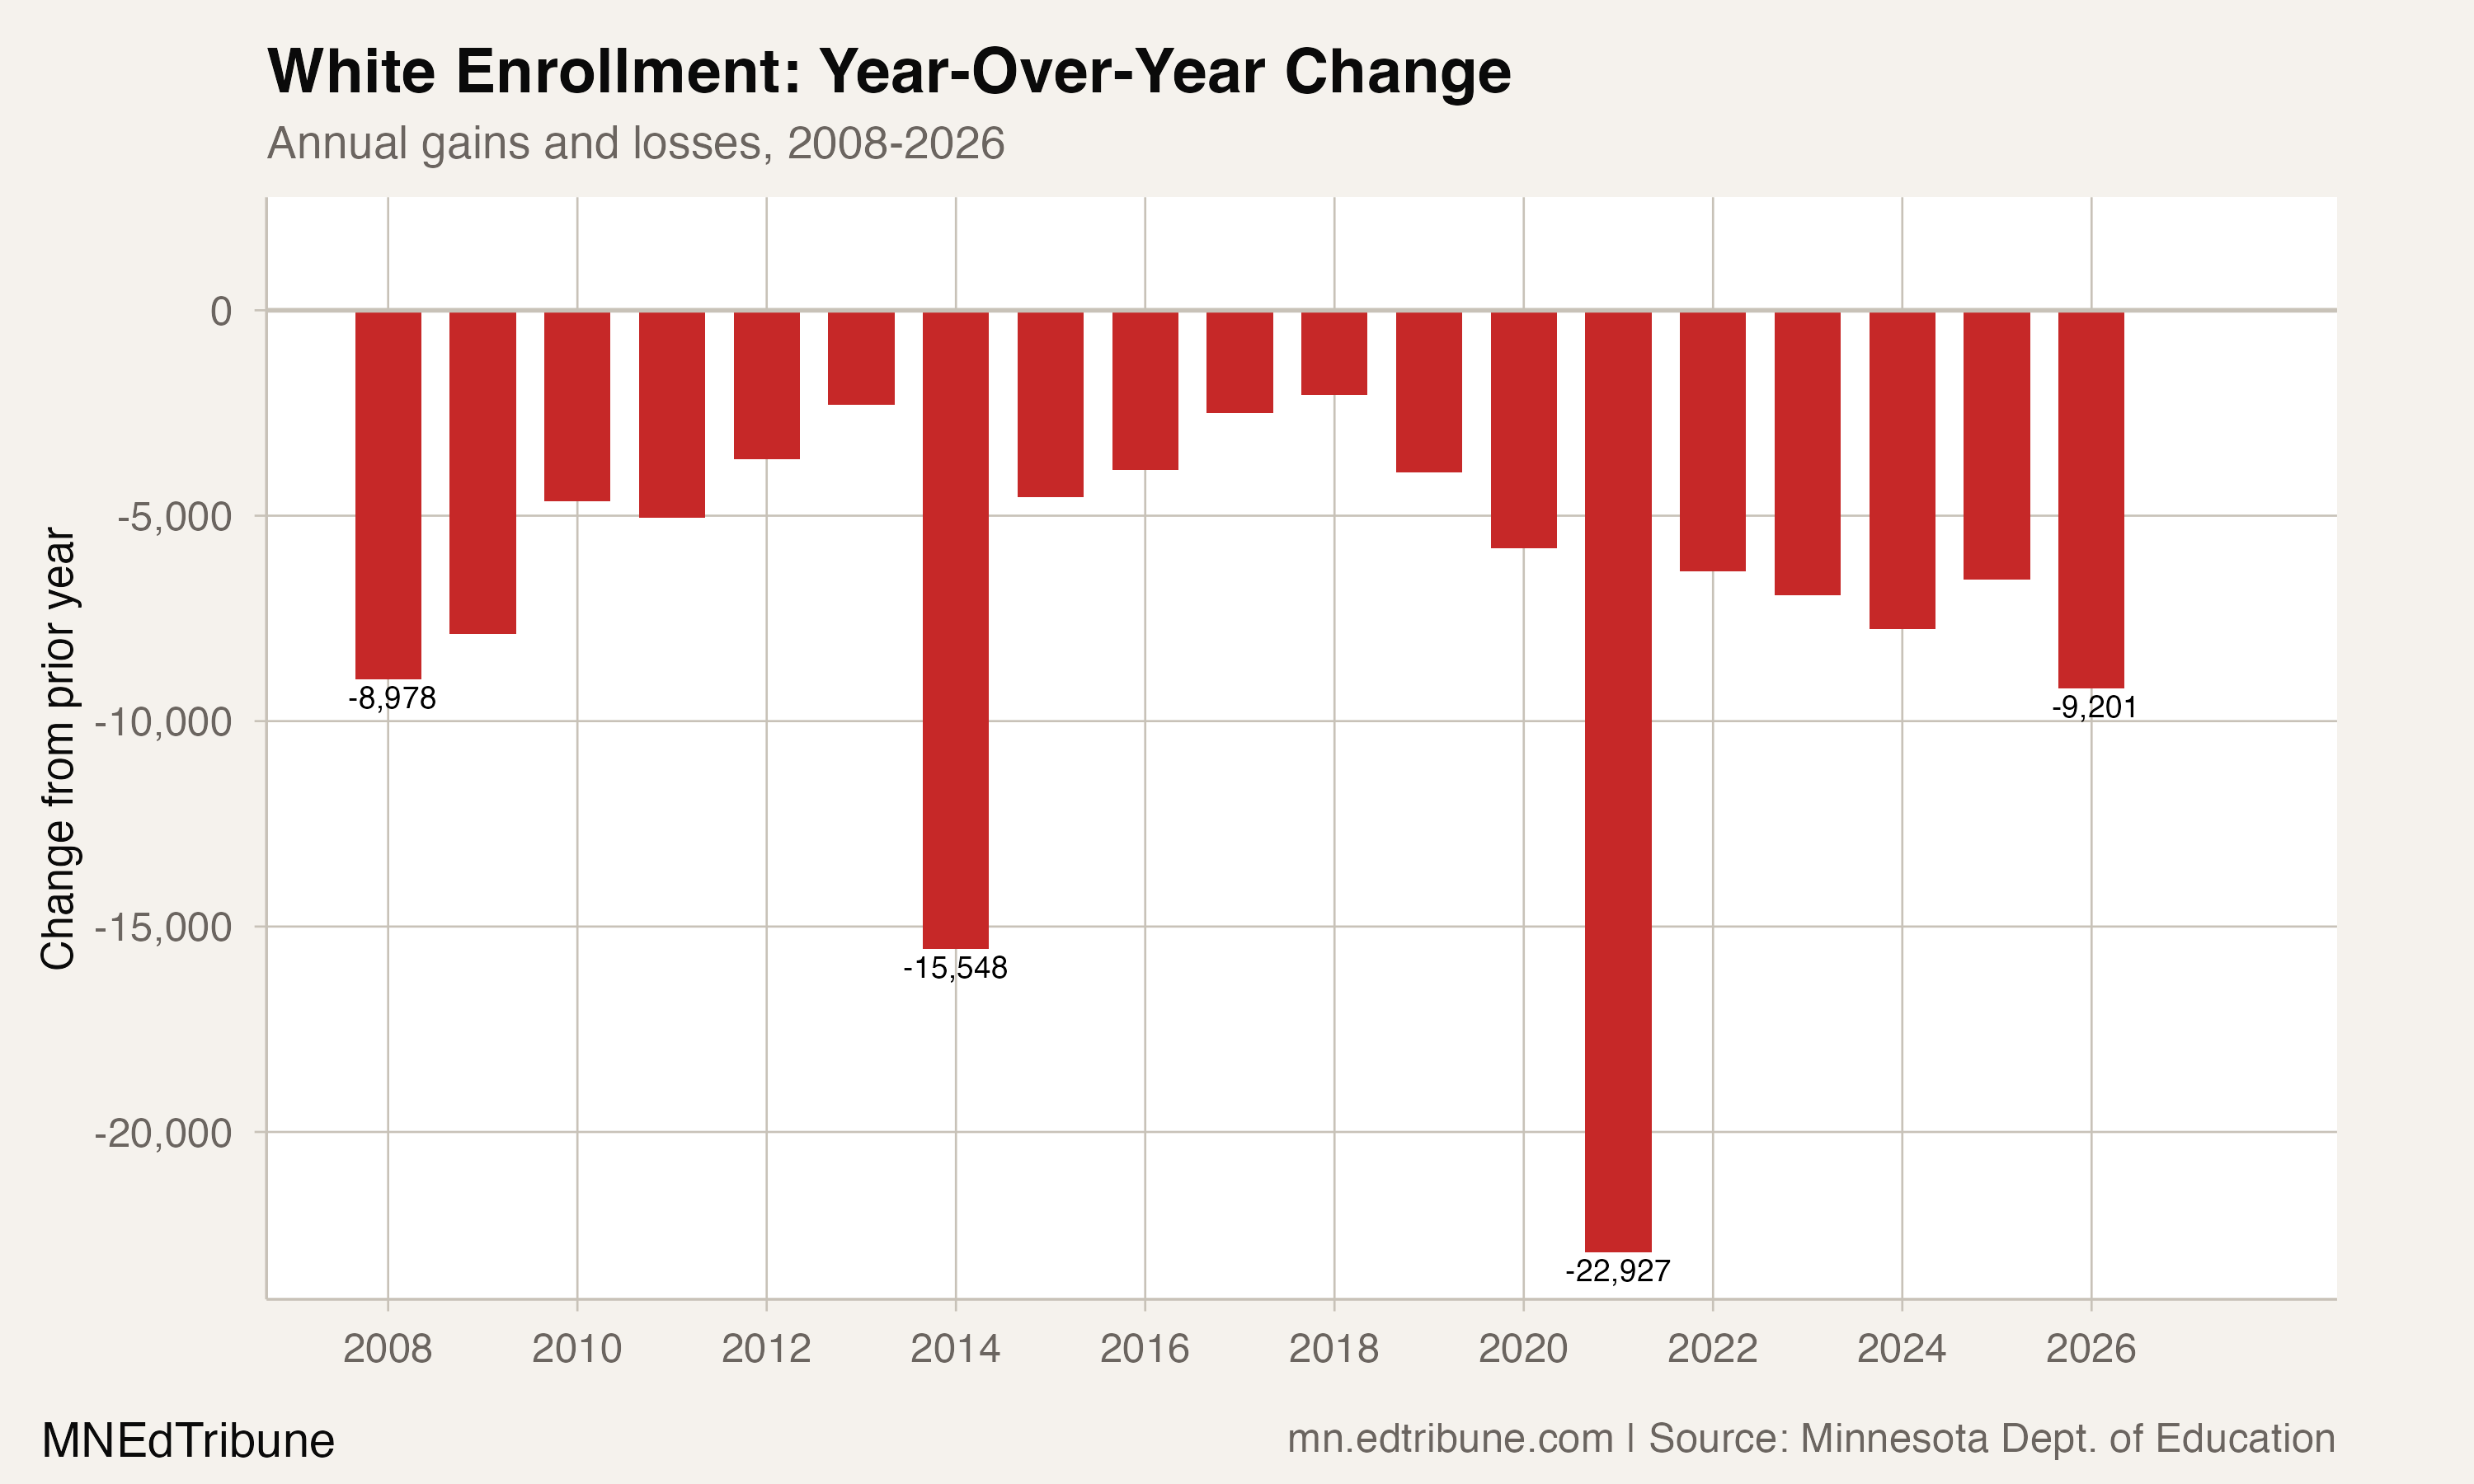
Post-COVID, the pace never returned to its pre-pandemic baseline. The state lost 6,349 white students in 2022, 6,939 in 2023, 7,761 in 2024, 6,553 in 2025, and 9,201 in 2026. The 2022-2026 average of about 7,361 white students lost per year is roughly 36% higher than the 2012-2017 average of about 5,404.
The 2026 loss of 9,201 is the largest non-COVID single-year white enrollment decline on record.
A first dip for Hispanic enrollment
One notable 2026 data point: Hispanic enrollment fell by 137 students, from 101,440 to 101,303. After 18 consecutive years of growth that more than doubled the Hispanic student population, this is the first decline in the dataset. Whether it reflects a statistical blip, a demographic plateau, or the chilling effect of federal immigration enforcement on school enrollment is impossible to determine from a single year of data.
Immigration as counterweight
Minnesota's white enrollment decline of 130,507 students is a demographic fact. The mechanisms behind it are layered. Birth rates are the primary structural driver. Outmigration, whether to exurban districts, neighboring states, or private and home schooling, contributes to district-level variation. Some fraction of the multiracial category's growth (+18,552 since 2014) may reflect reclassification of students who would previously have been counted as white, though the magnitude is uncertain.
What enrollment data cannot measure is the degree to which housing costs, school perception, and neighborhood change interact with these demographic forces. Worthington↗ET, a meatpacking town in southwestern Minnesota, has one of the state's highest Hispanic enrollment shares and lowest white shares among outstate districts. St. Cloud's Somali community has made it the fastest-diversifying large district outside the metro. Both cases suggest that immigration, not just birth rate decline, is reshaping Minnesota's enrollment map.
The state demographer projects that Minnesota's deaths will outpace births around 2040. International immigration added roughly 30,000 net new residents to the state over a recent three-year period. If current federal immigration policies slow that flow, Minnesota faces a straightforward arithmetic problem: white births are declining, deaths are projected to outpace births by 2040, and 30,000 net international immigrants over a recent three-year period accounted for nearly all of the state's population growth. Without that immigration, Minnesota's schools do not just become less diverse. They become smaller.
Detailed code that reproduces the analysis and figures in this article is available exclusively to EdTribune subscribers.
Discussion
Sign in to join the discussion.
Loading comments...