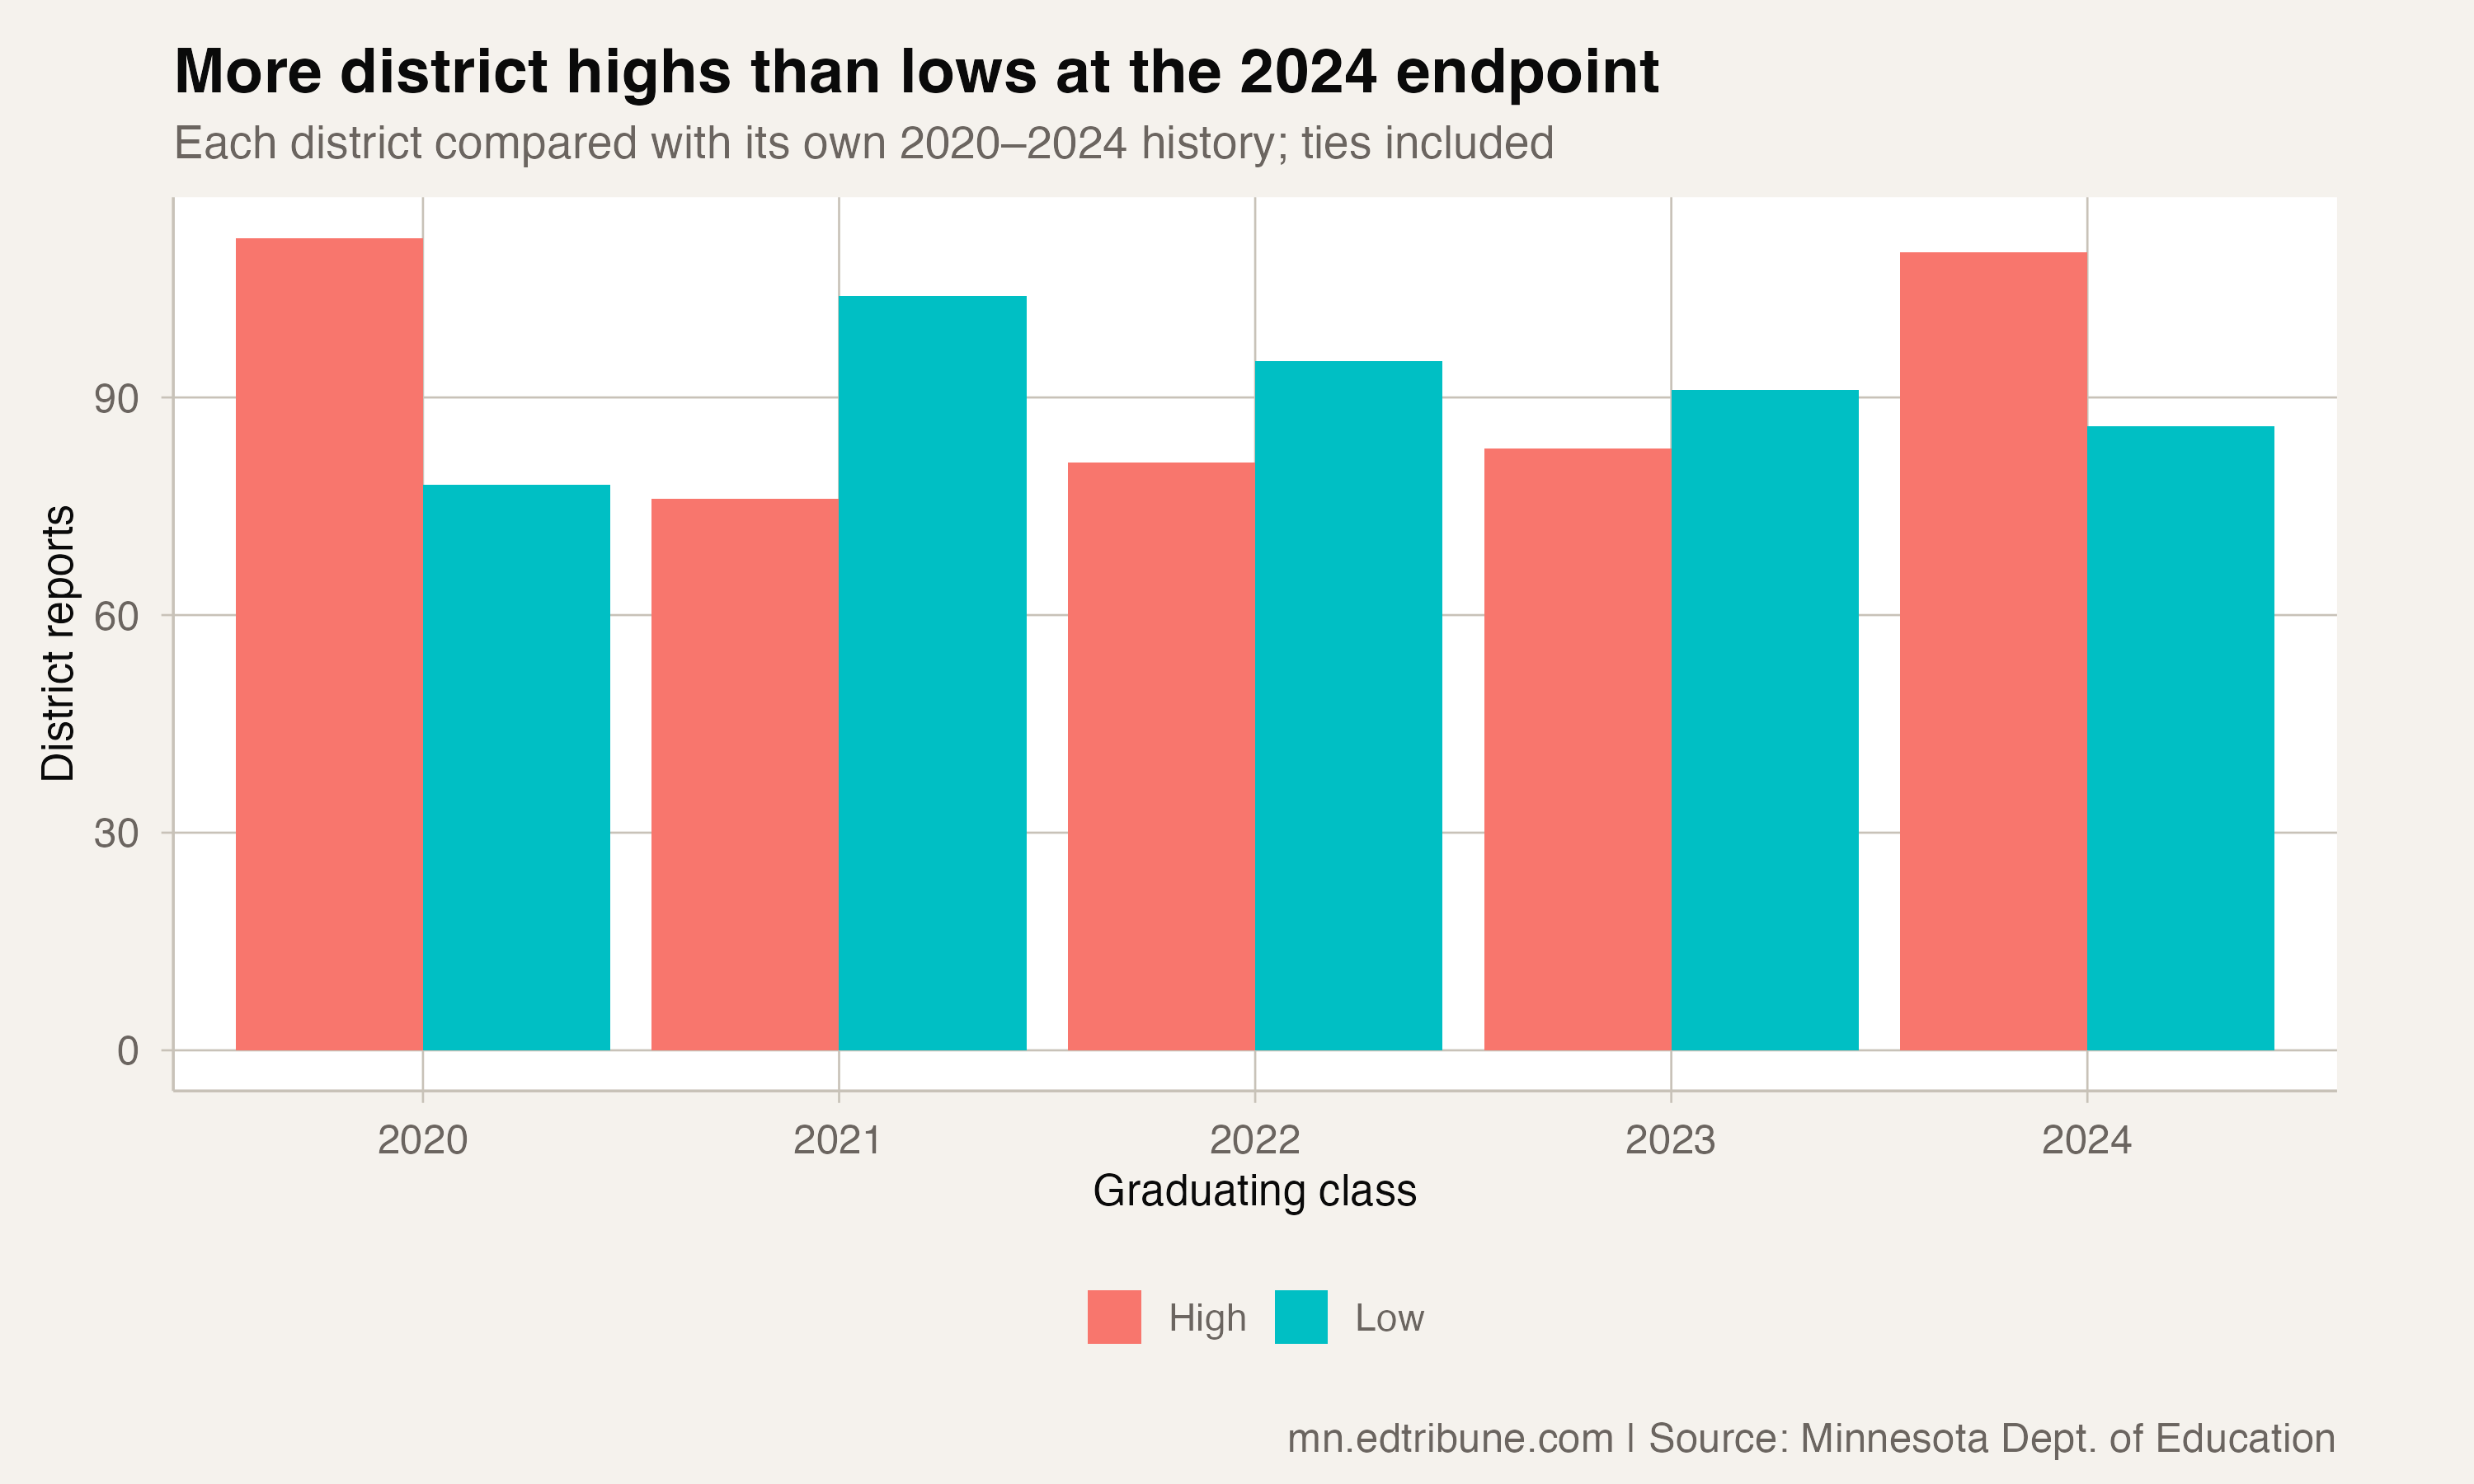
Minnesota's historical district graduation reports show contrasting outcomes for the Class of 2024. In a common panel of 415 district reports covering the Classes of 2020 through 2024, 110 districts matched their highest published four-year graduation rate, while 86 matched their lowest.
These are five-year highs and lows, including ties. They are not all-time records, and the comparison does not describe the Class of 2025 or the current school year. Districts without a finite rate in every year of the panel are excluded.
The comparison is with each district's own history
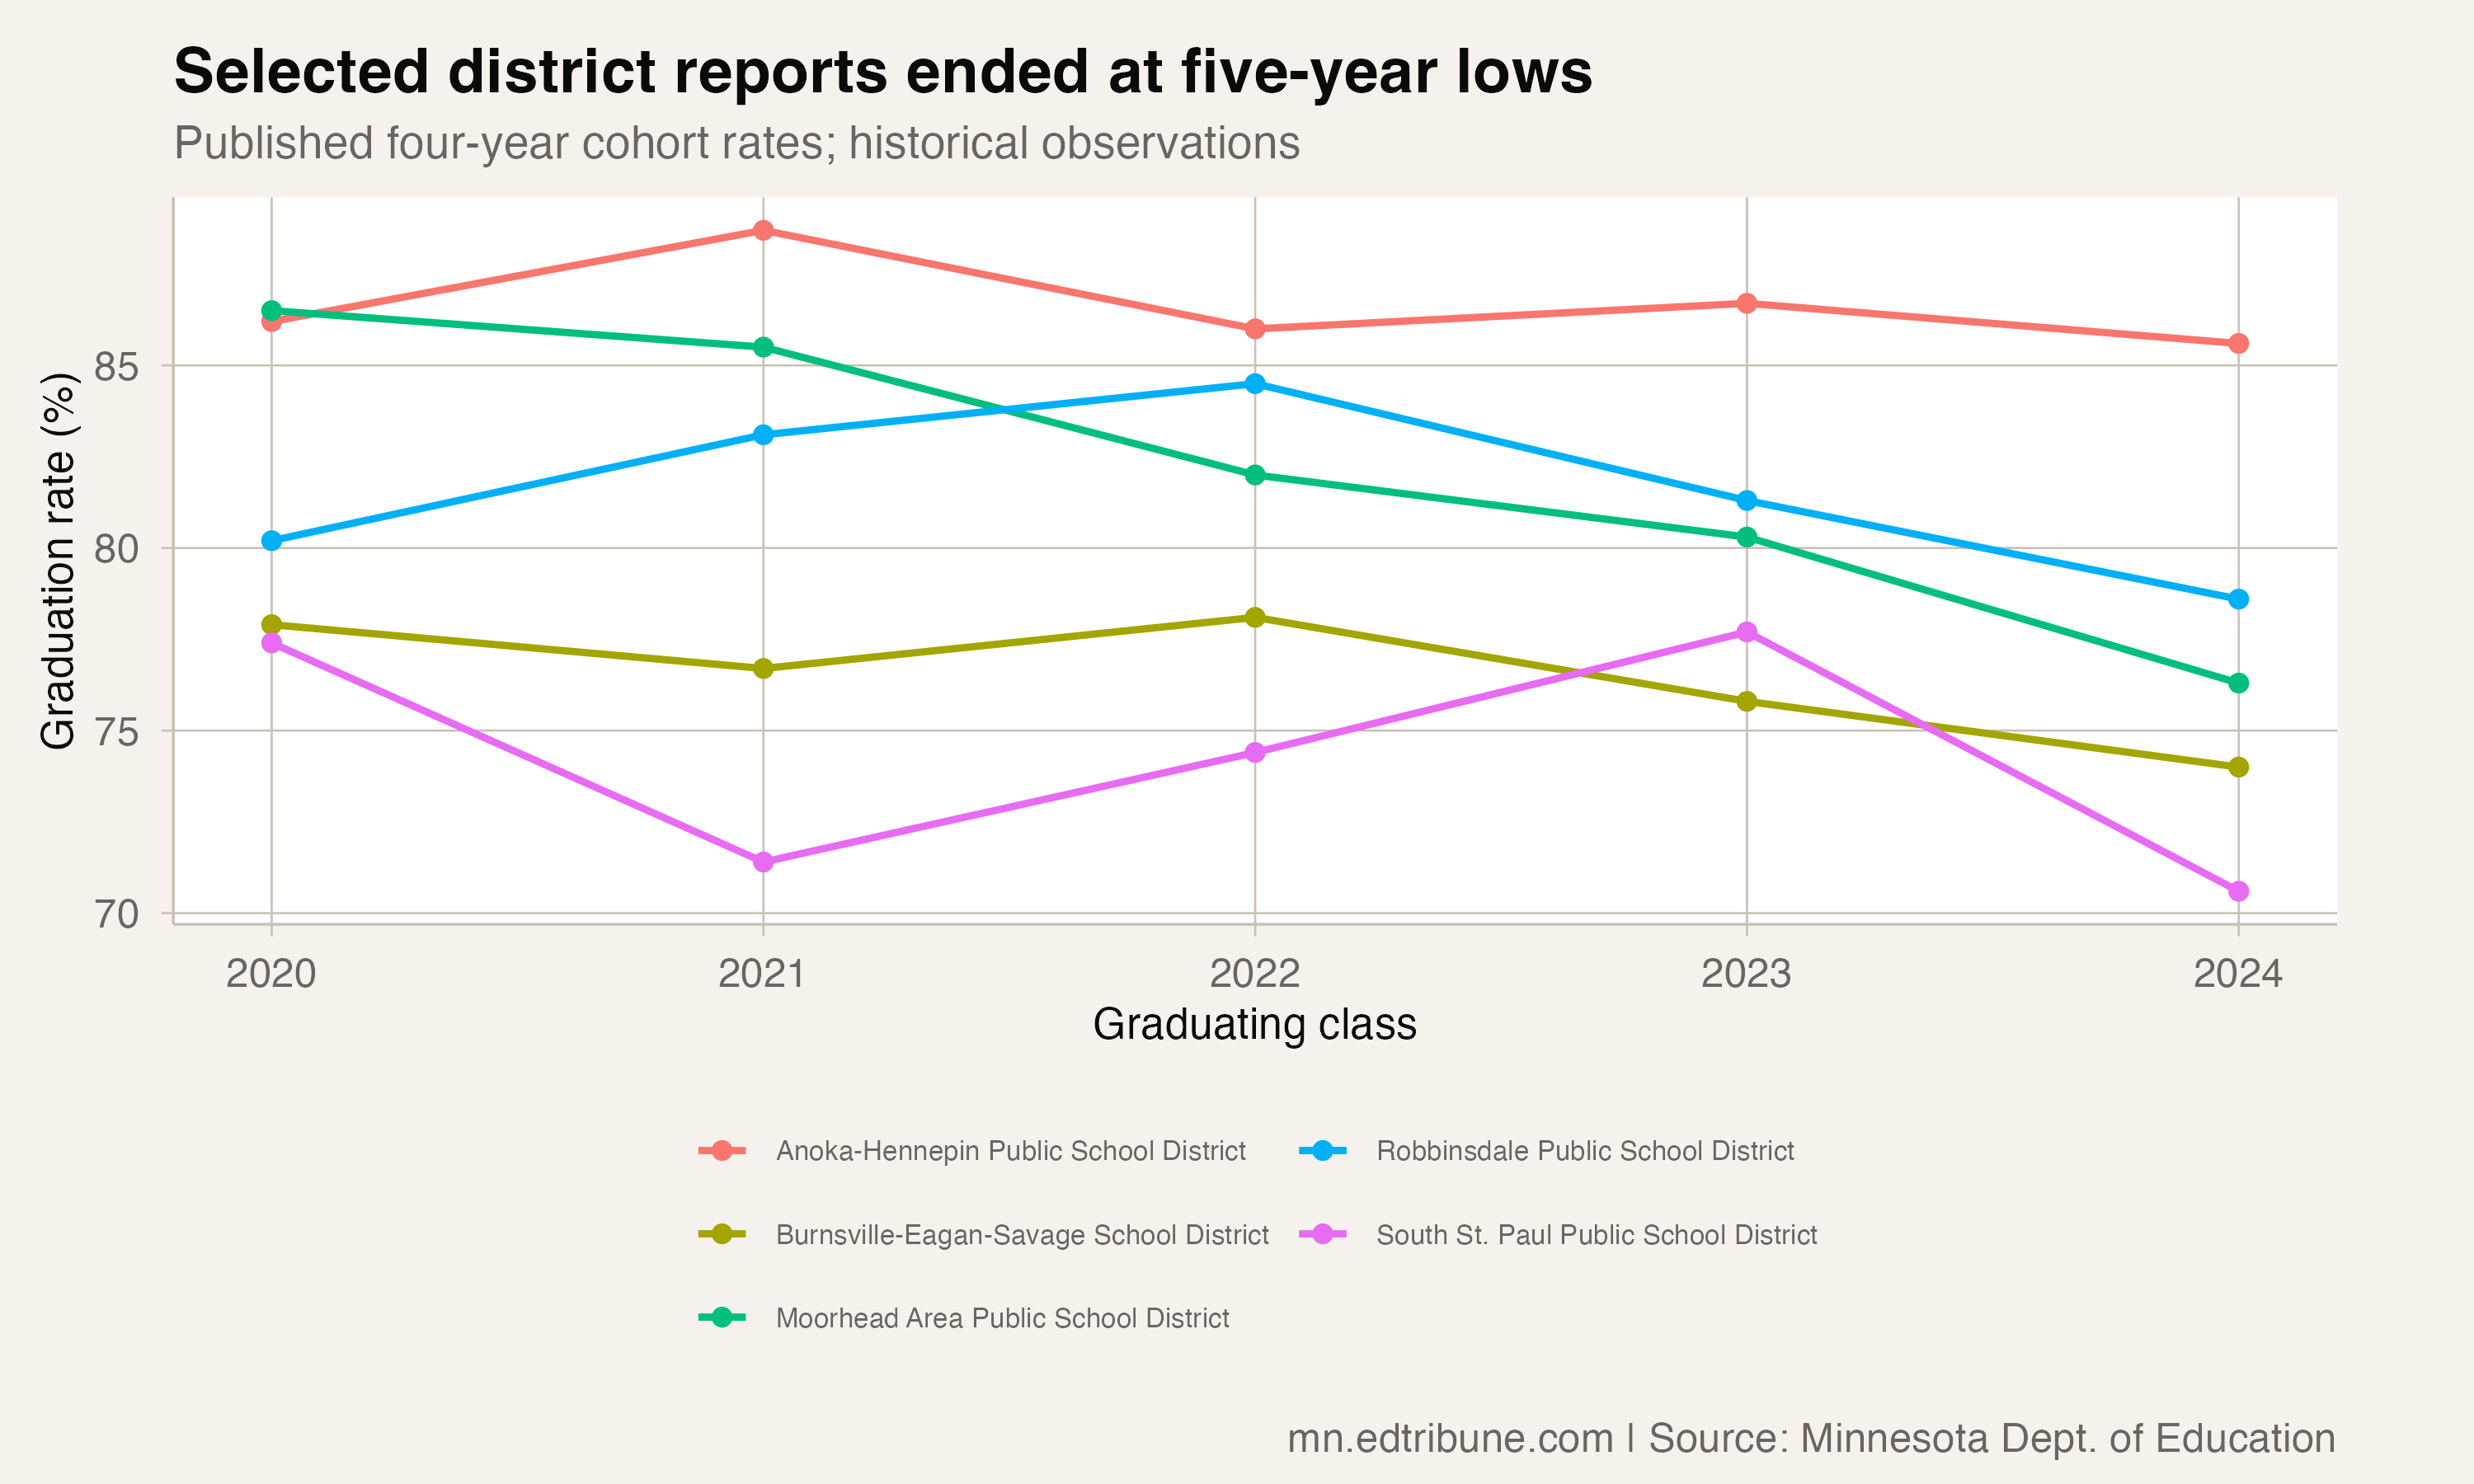
Burnsville-Eagan-Savage School District↗ET reported a 74.0% four-year graduation rate for the Class of 2024. Moorhead Area Public School District↗ET reported 76.3%, South St. Paul Public School District↗ET reported 70.6%, and Robbinsdale Public School District↗ET reported 78.6%. Each matched its lowest rate in the historical panel.
Anoka-Hennepin Public School District↗ET also finished at its panel low, at 85.6%. Its reported cohort contained 3,303 students. A district's lowest rate in a short window can still differ substantially from another district's lowest rate. The classification records a district's position within its own history, rather than a ranking of school quality.
More highs than lows at the endpoint
The common panel had 104 districts at their own five-year lows for the Class of 2021 and 76 at highs. At the 2024 endpoint the balance went the other way. That change in the count does not mean every district improved, or that the same districts changed categories.
Delano's published Class of 2024 rate was 98.9%, New Ulm's was 97.6%, and Stillwater Area's was 93.5%. Each matched its highest rate in the panel. The contrast with the named districts at lows is visible in their published outcomes, without attributing it to a particular policy or program.
A flat series can match both its minimum and maximum. For that reason the high and low counts are not presented as mutually exclusive groups that divide the state. Ties are included consistently at every year of the comparison.
Cohort rates need their own context
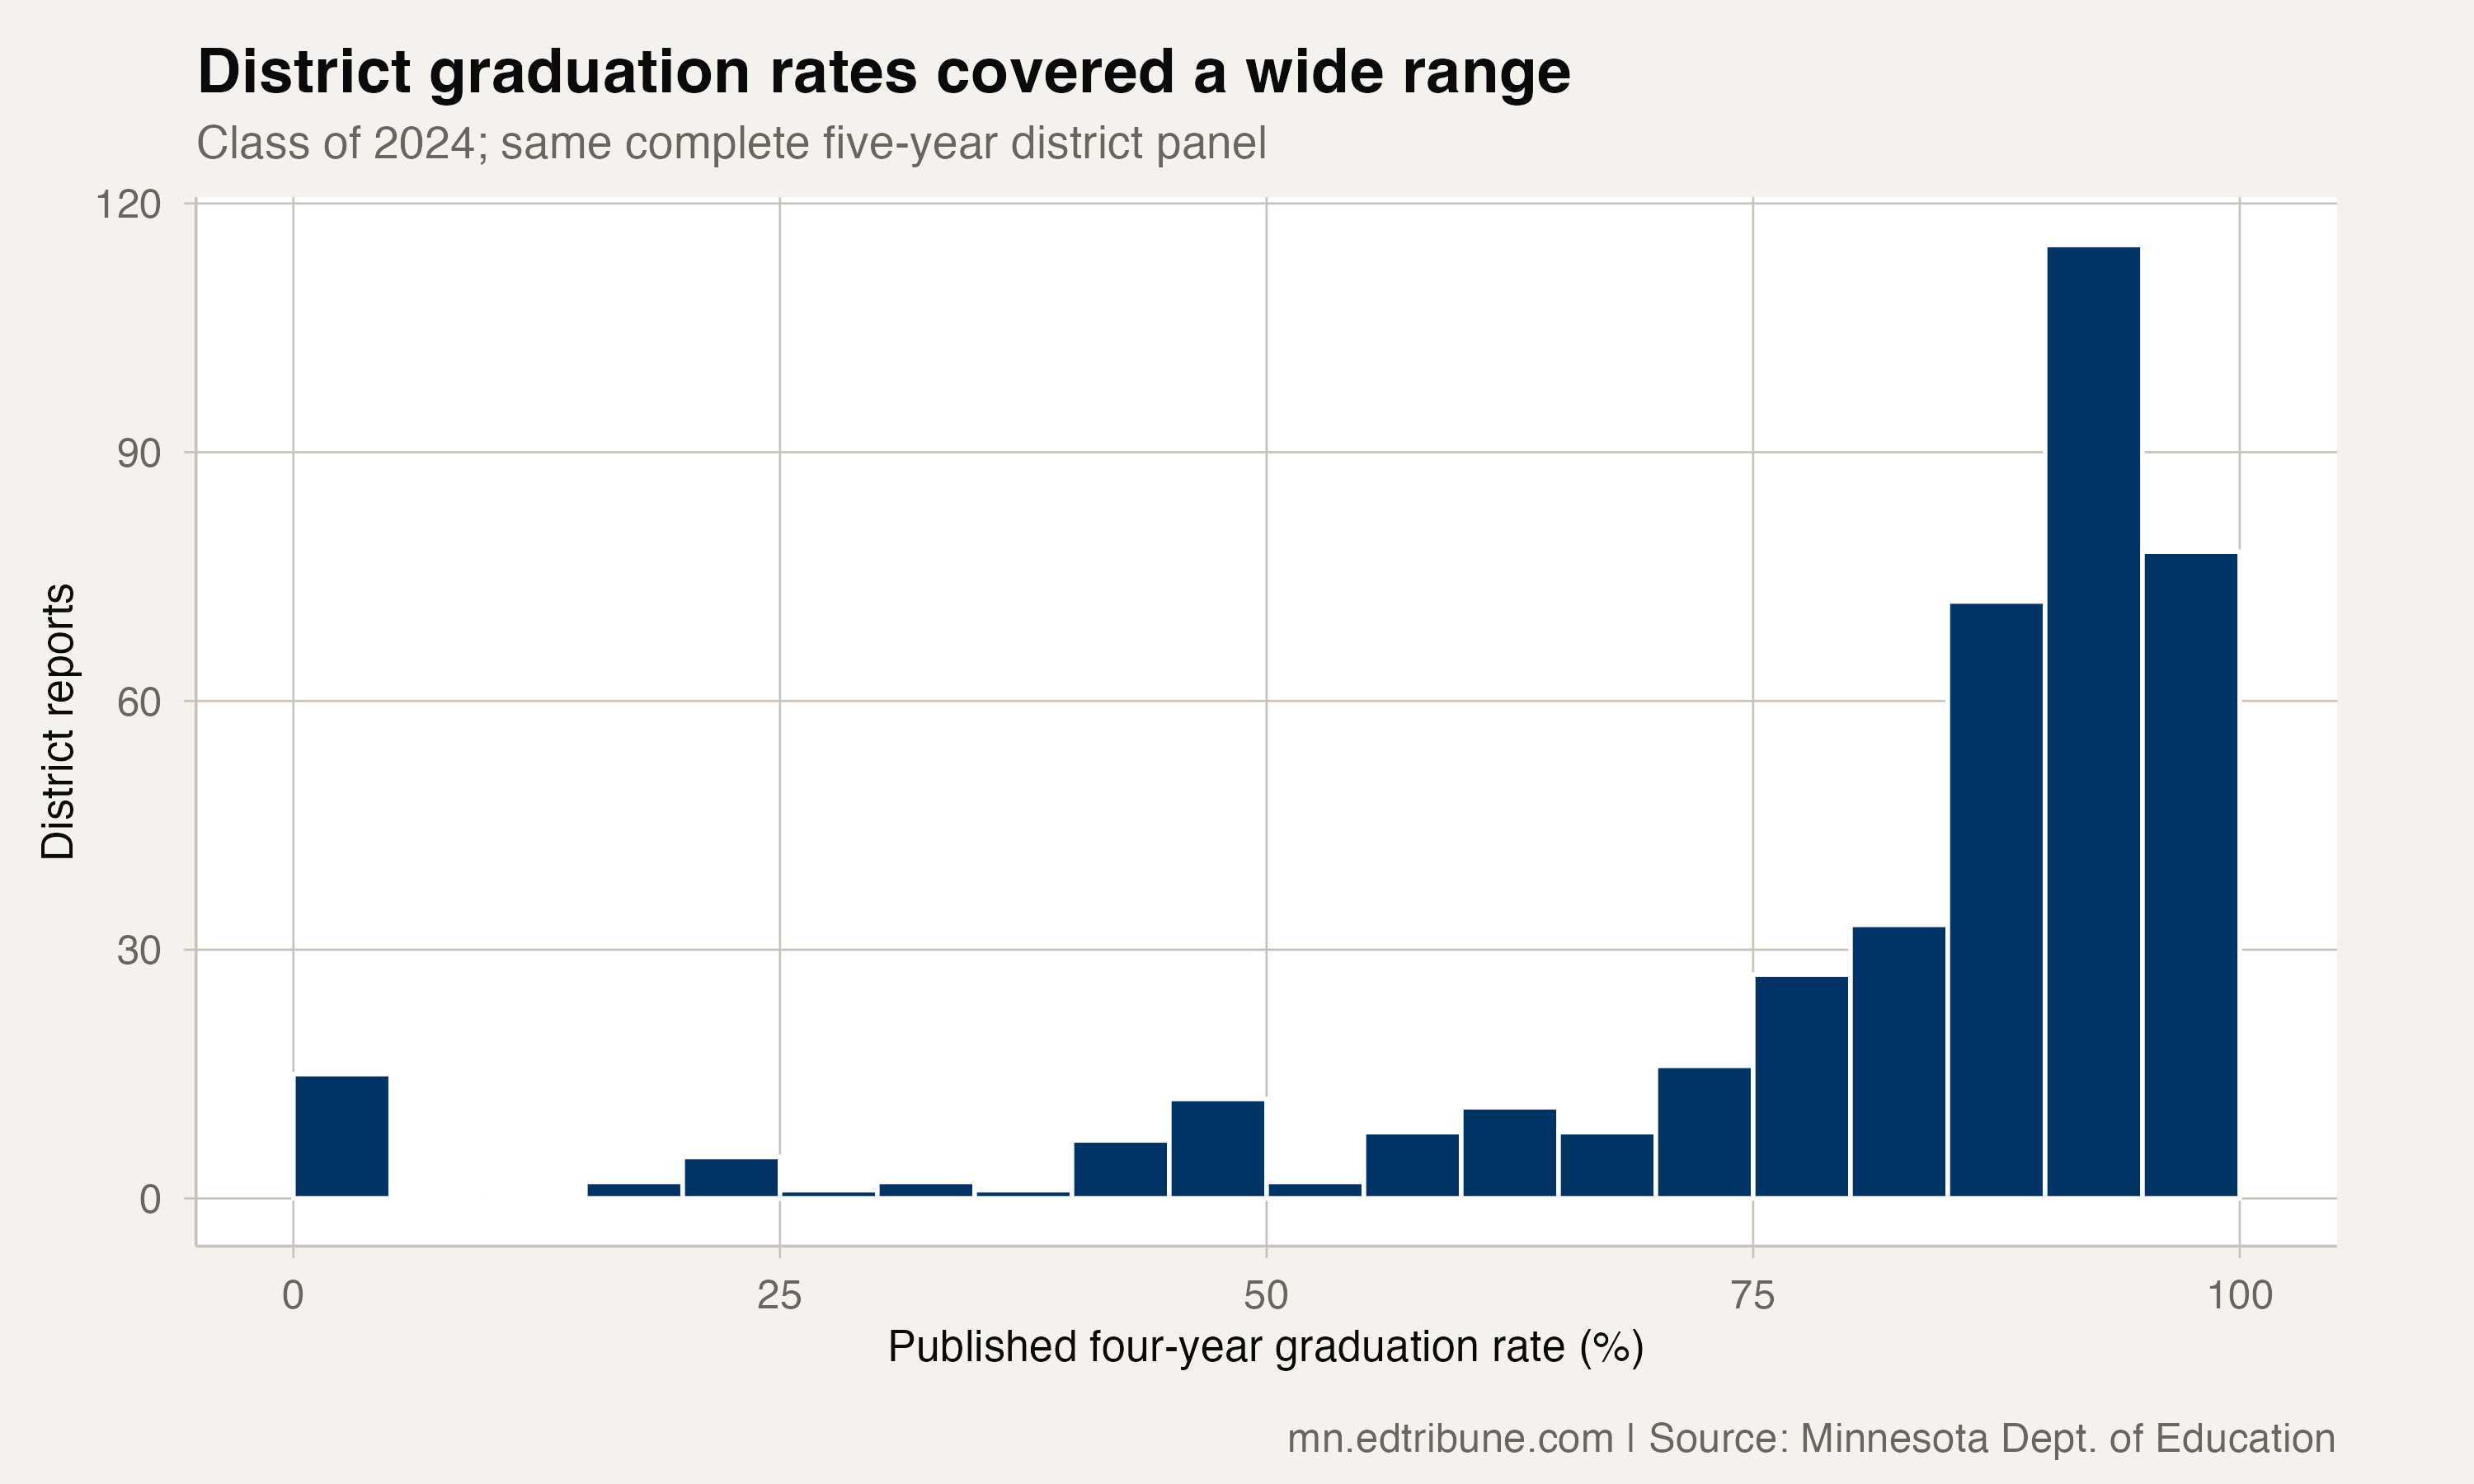
District four-year graduation rates covered a wide range at the 2024 endpoint. A distribution of district rates gives each district report one observation; it does not give each student equal weight. It therefore cannot be substituted for a published statewide graduation rate or described as the typical student's experience.
The figures come from the Minnesota Department of Education's graduation reporting. They compare separately reported graduating cohorts, rather than tracking one fixed group of students through all five years.
The historical result is a more qualified account than an all-time record headline. More district reports reached their panel highs than their panel lows at the endpoint, while the named districts at lows had different rates and cohort sizes. Explaining those local paths requires evidence beyond the graduation table itself.
Detailed code that reproduces the analysis and figures in this article is available exclusively to EdTribune subscribers.
Discussion
Sign in to join the discussion.
Loading comments...