Correction (August 20, 2026): An earlier preview mixed district and campus rows in a charter enrollment comparison and compared a concentration index across a changing category universe. Those claims and external numeric context have been removed. Every remaining number now traces to current district-grain Minnesota enrollment records.
In this series: Minnesota 2025-26 Enrollment.
In most of Minnesota's large public school districts, one racial group is clearly larger than the rest. Statewide, white students account for 59.4% of enrollment.
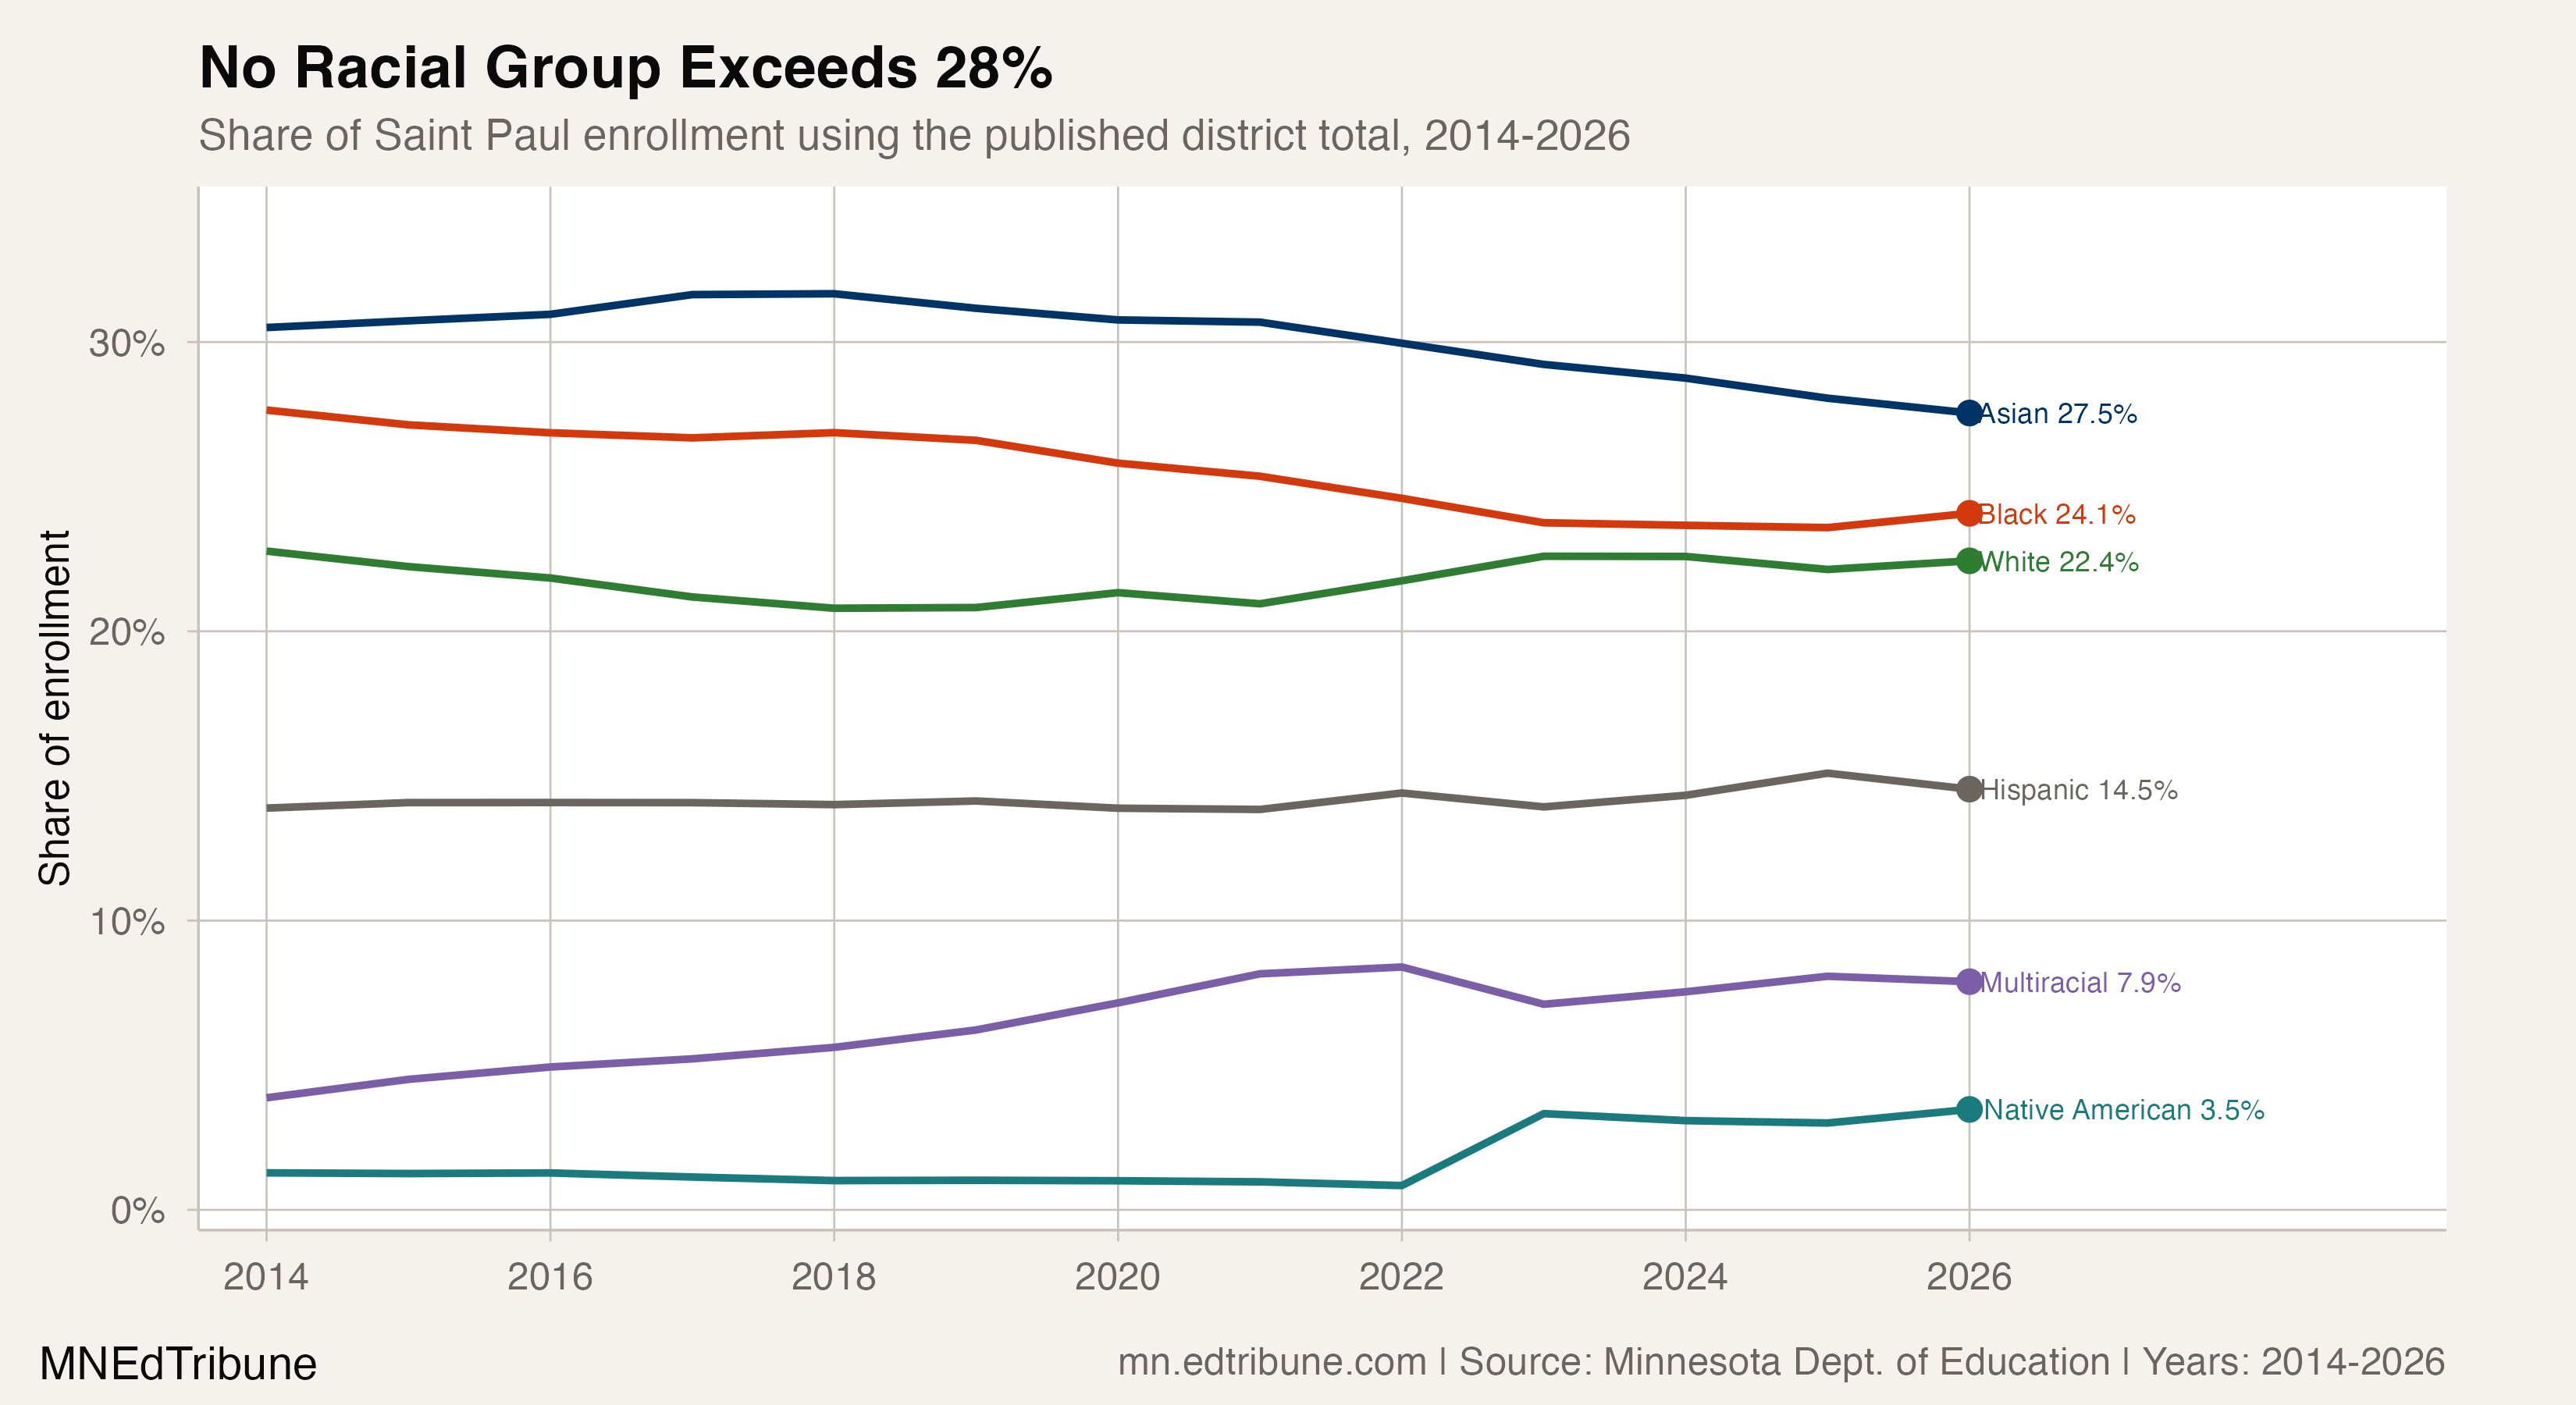
Saint Paul↗ET looks different. Asian students account for 27.5% of district enrollment, Black students 24.1%, white students 22.4% and Hispanic students 14.5%. No group exceeds 28%.
Among Minnesota's 16 non-charter districts enrolling more than 10,000 students in 2025-26, Saint Paul has the smallest largest-group share. That makes it the state's most evenly distributed large district by a direct, limited measure: the share held by its largest racial group.
The measure does not explain how Saint Paul reached this balance. The Minnesota Historical Society's Hmong collection documents one important part of the city's migration history, while the district's language- and culture-focused programs have become a visible part of its enrollment strategy. Those are suggestive contexts, not proof that any one migration or program produced the current distribution.
Evenness without a majority
Saint Paul's largest group has become less dominant over time. Asian students represented 30.5% of enrollment in 2014, compared with 27.5% in 2026. Black enrollment moved from 27.6% to 24.1% over the same span. White enrollment shifted from 22.8% to 22.4%, while Hispanic enrollment moved from 13.9% to 14.5%.
The top two groups in 2026 were separated by 3.5 percentage points. The next-most-even large district was North St. Paul-Maplewood-Oakdale↗ET, where the largest racial group accounted for 31.2% of enrollment.
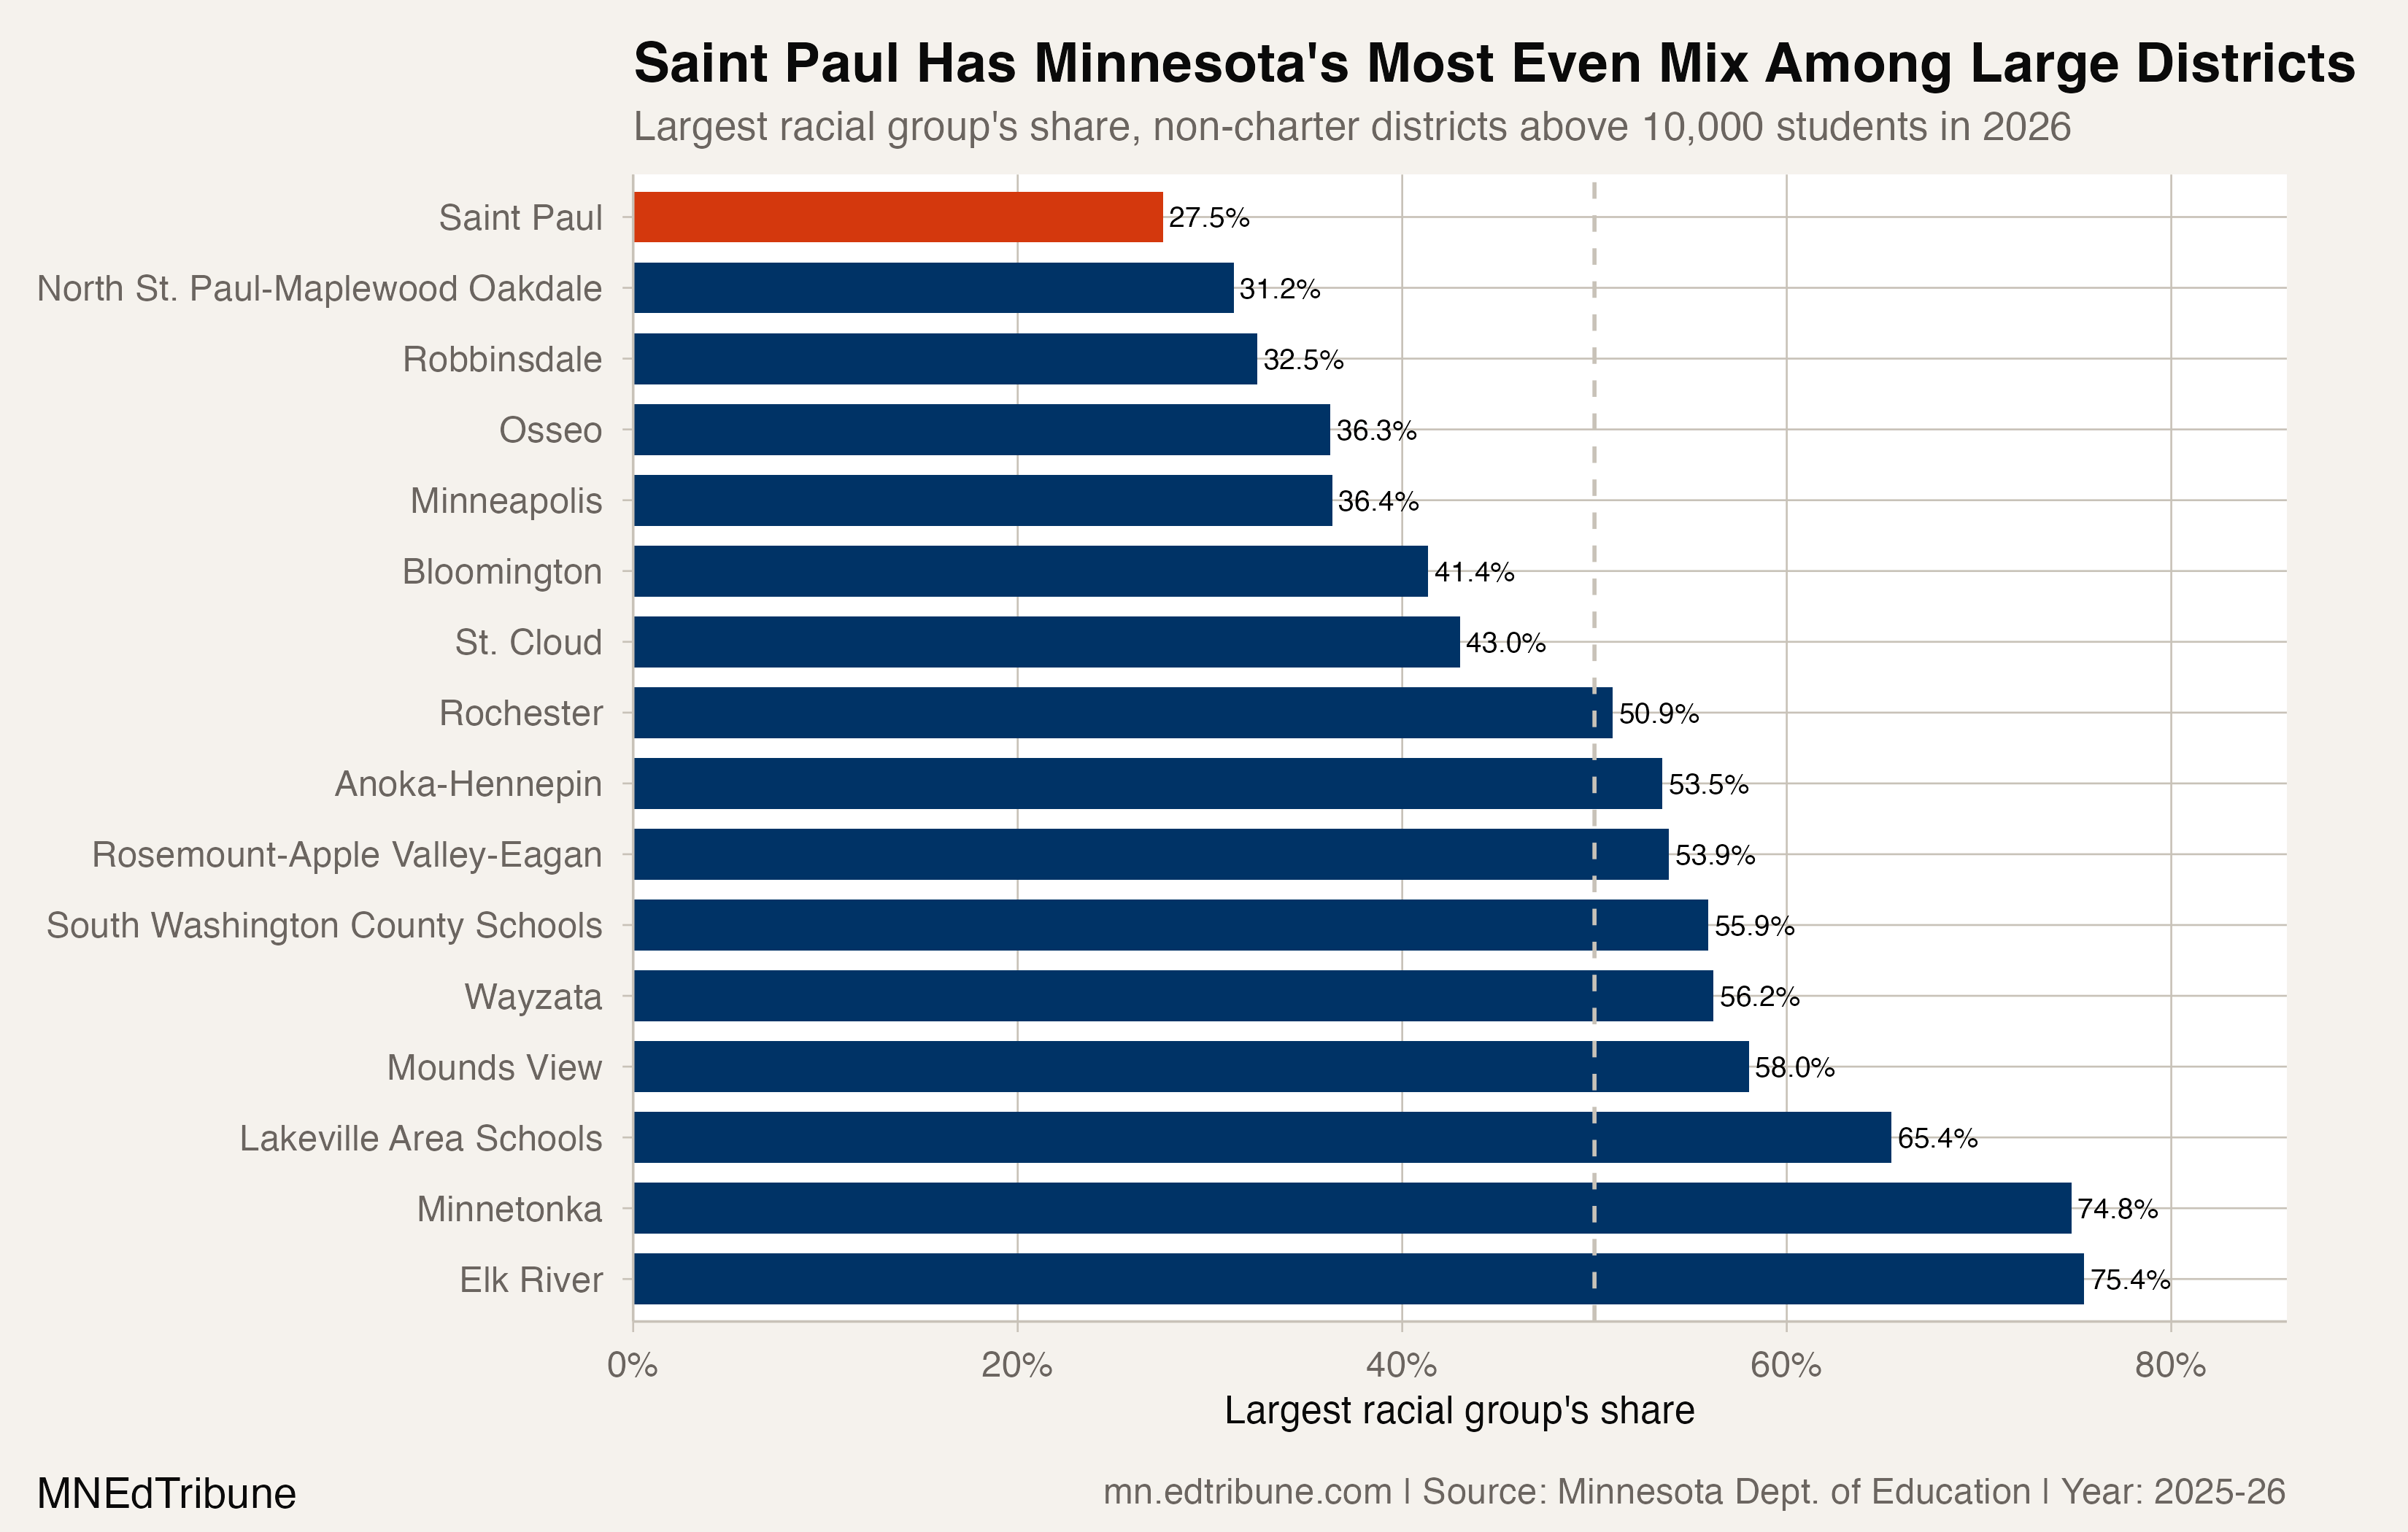
The comparison uses the state's published district totals as the denominator for every share. The racial categories reconcile to those totals in each Saint Paul year used here. The 10,000-student cutoff is an editorial definition of “large,” not a state classification, and the ranking applies only to the 16 non-charter districts above it.
Balance inside a smaller system
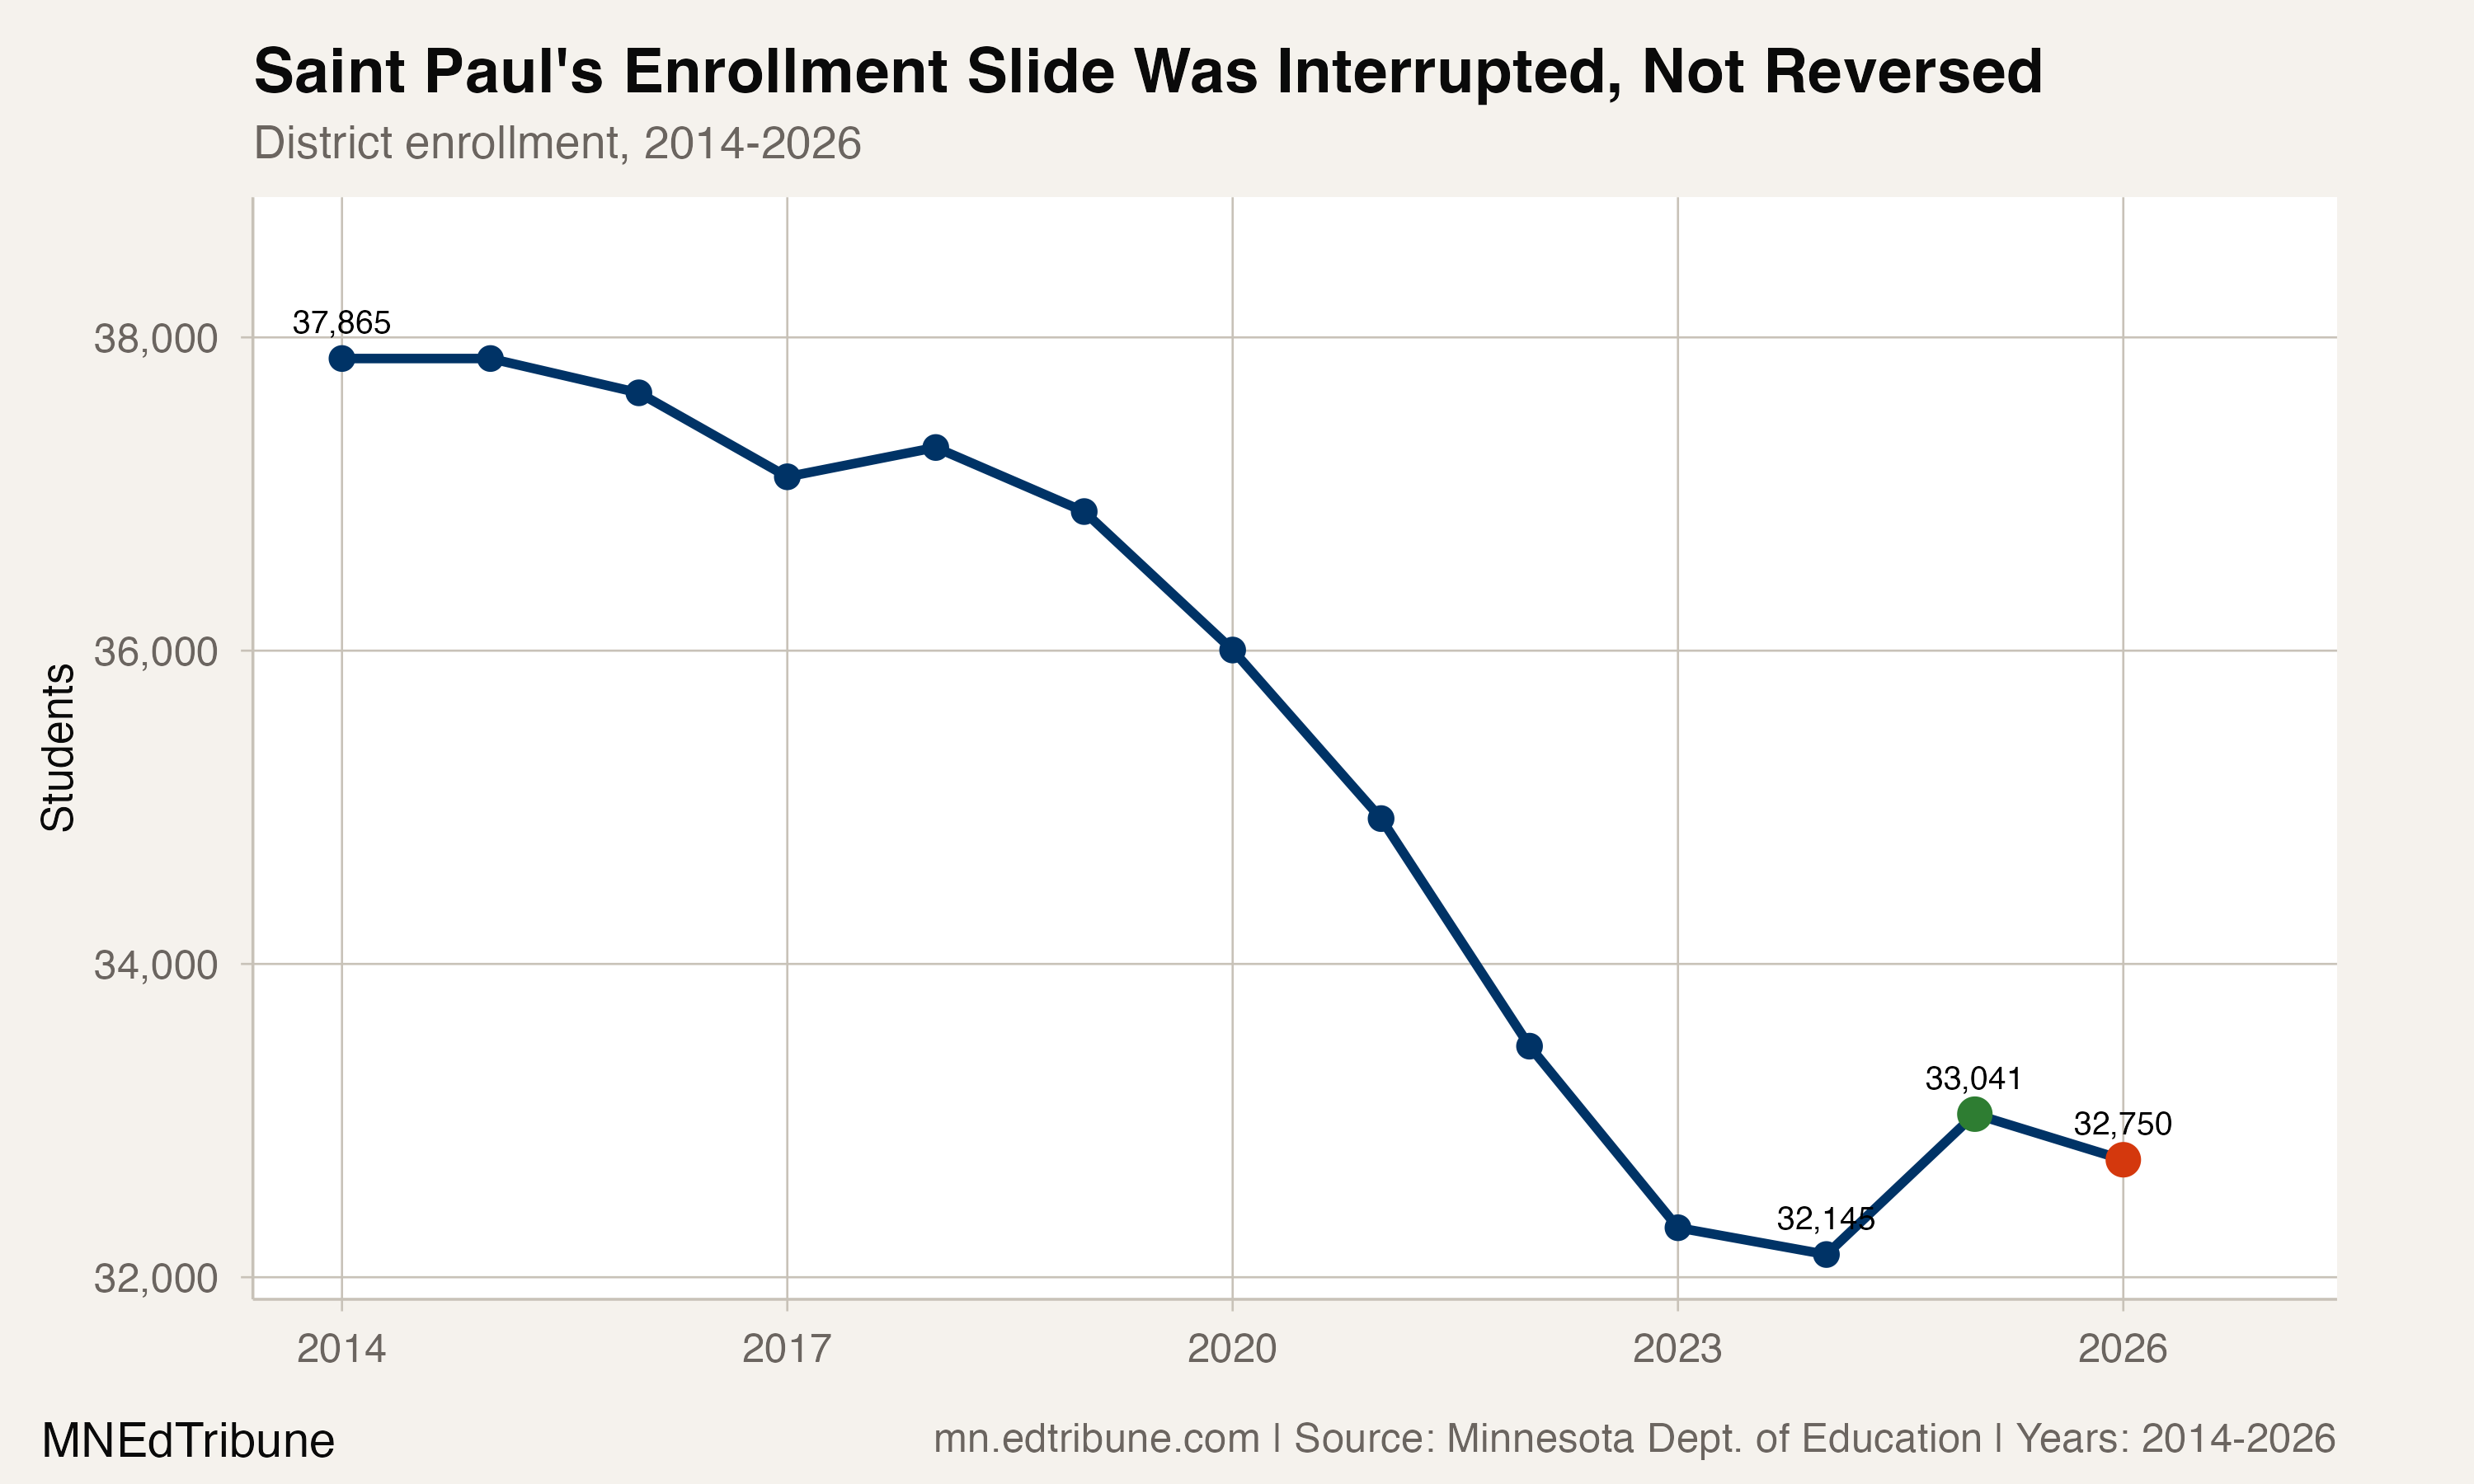
The composition story sits inside a long enrollment decline. Saint Paul enrolled 37,865 students in 2014 and 32,750 in 2026. That is a loss of 5,115 students, or 13.5%, over 12 years.
The largest numerical declines came among Black and Asian students. Black enrollment fell by 2,583 students, or 24.7%, from 2014 to 2026. Asian enrollment fell by 2,528, or 21.9%. White enrollment declined by 1,275, or 14.8%, and Hispanic enrollment declined by 496, or 9.4%. Multiracial enrollment moved in the other direction, increasing by 1,116, or 76.1%.
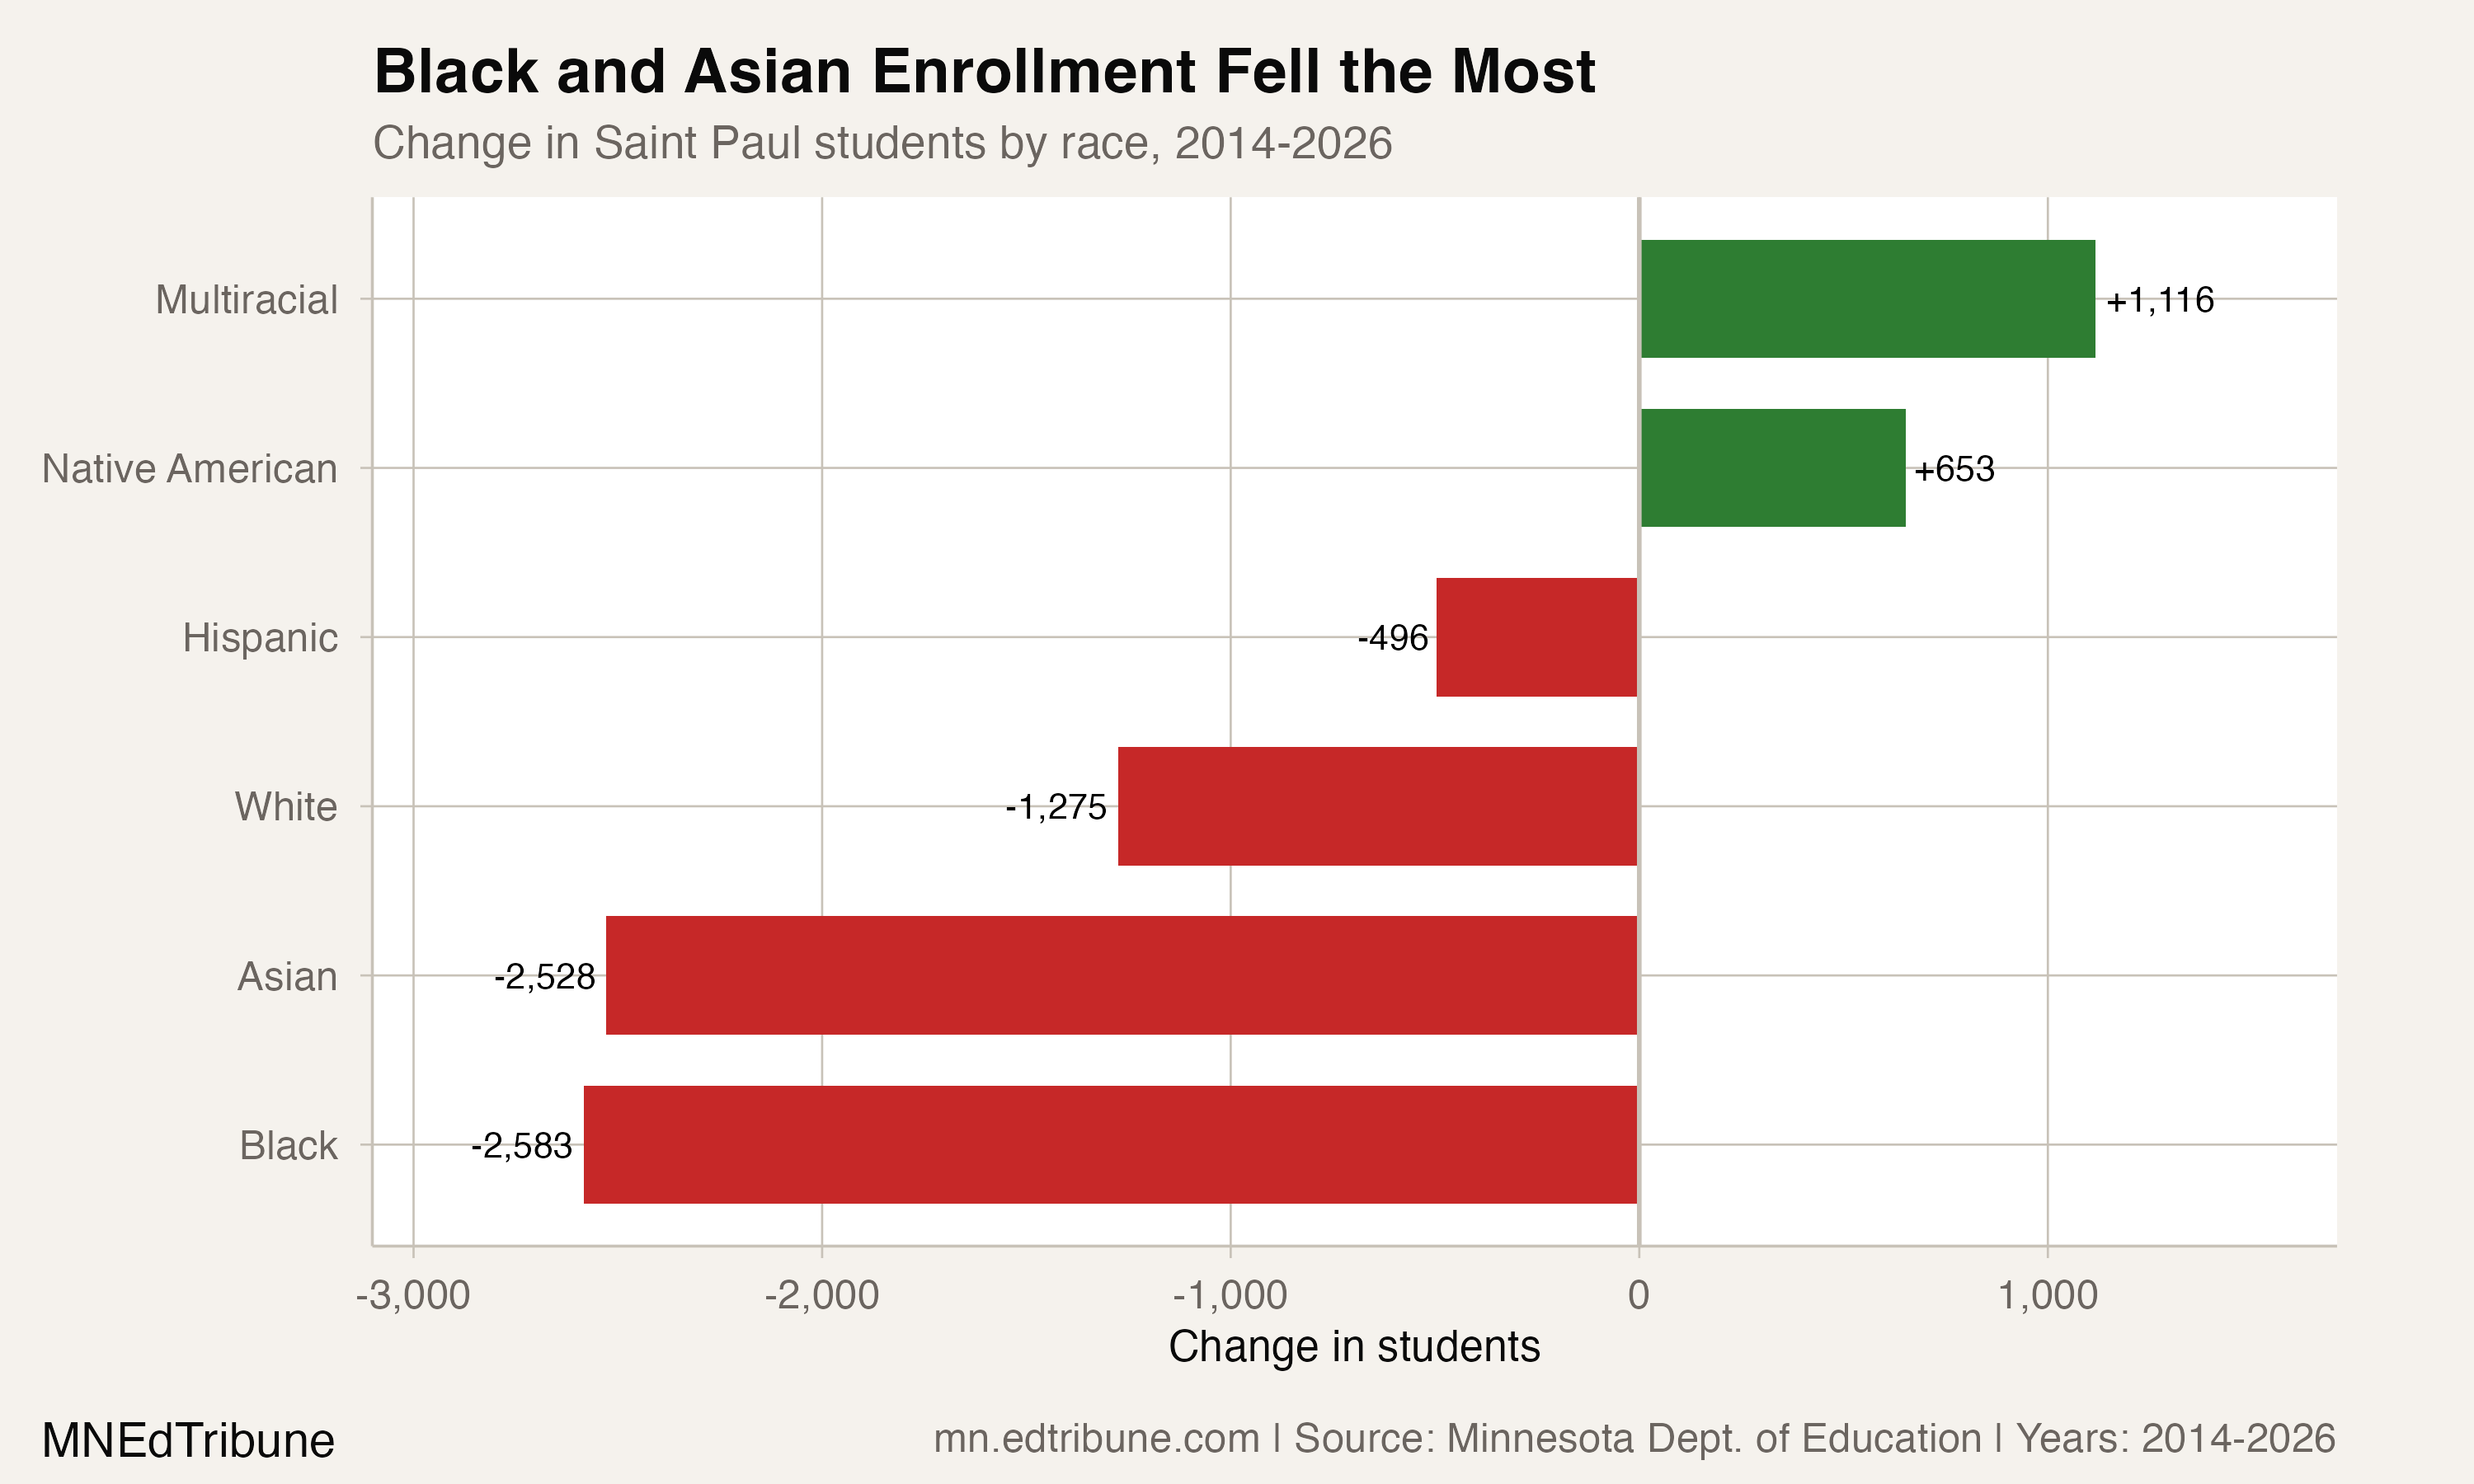
The enrollment records show the direction and scale of those changes, but not their causes. Classification choices, school selection, mobility and demographic change can all affect subgroup counts. Without a design that separates those forces, the subgroup movements should not be read as a claim that one group “replaced” another.
A rebound that lasted one year
Saint Paul lost 4,572 students across the four annual transitions from 2019 through 2023. The largest single-year decline in the full 2007-2026 record came in 2022, when enrollment fell by 1,453.
The district then recorded six straight annual declines through 2024. Enrollment rose from 32,145 in 2024 to 33,041 in 2025, a gain of 896, before falling by 291 to 32,750 in 2026.
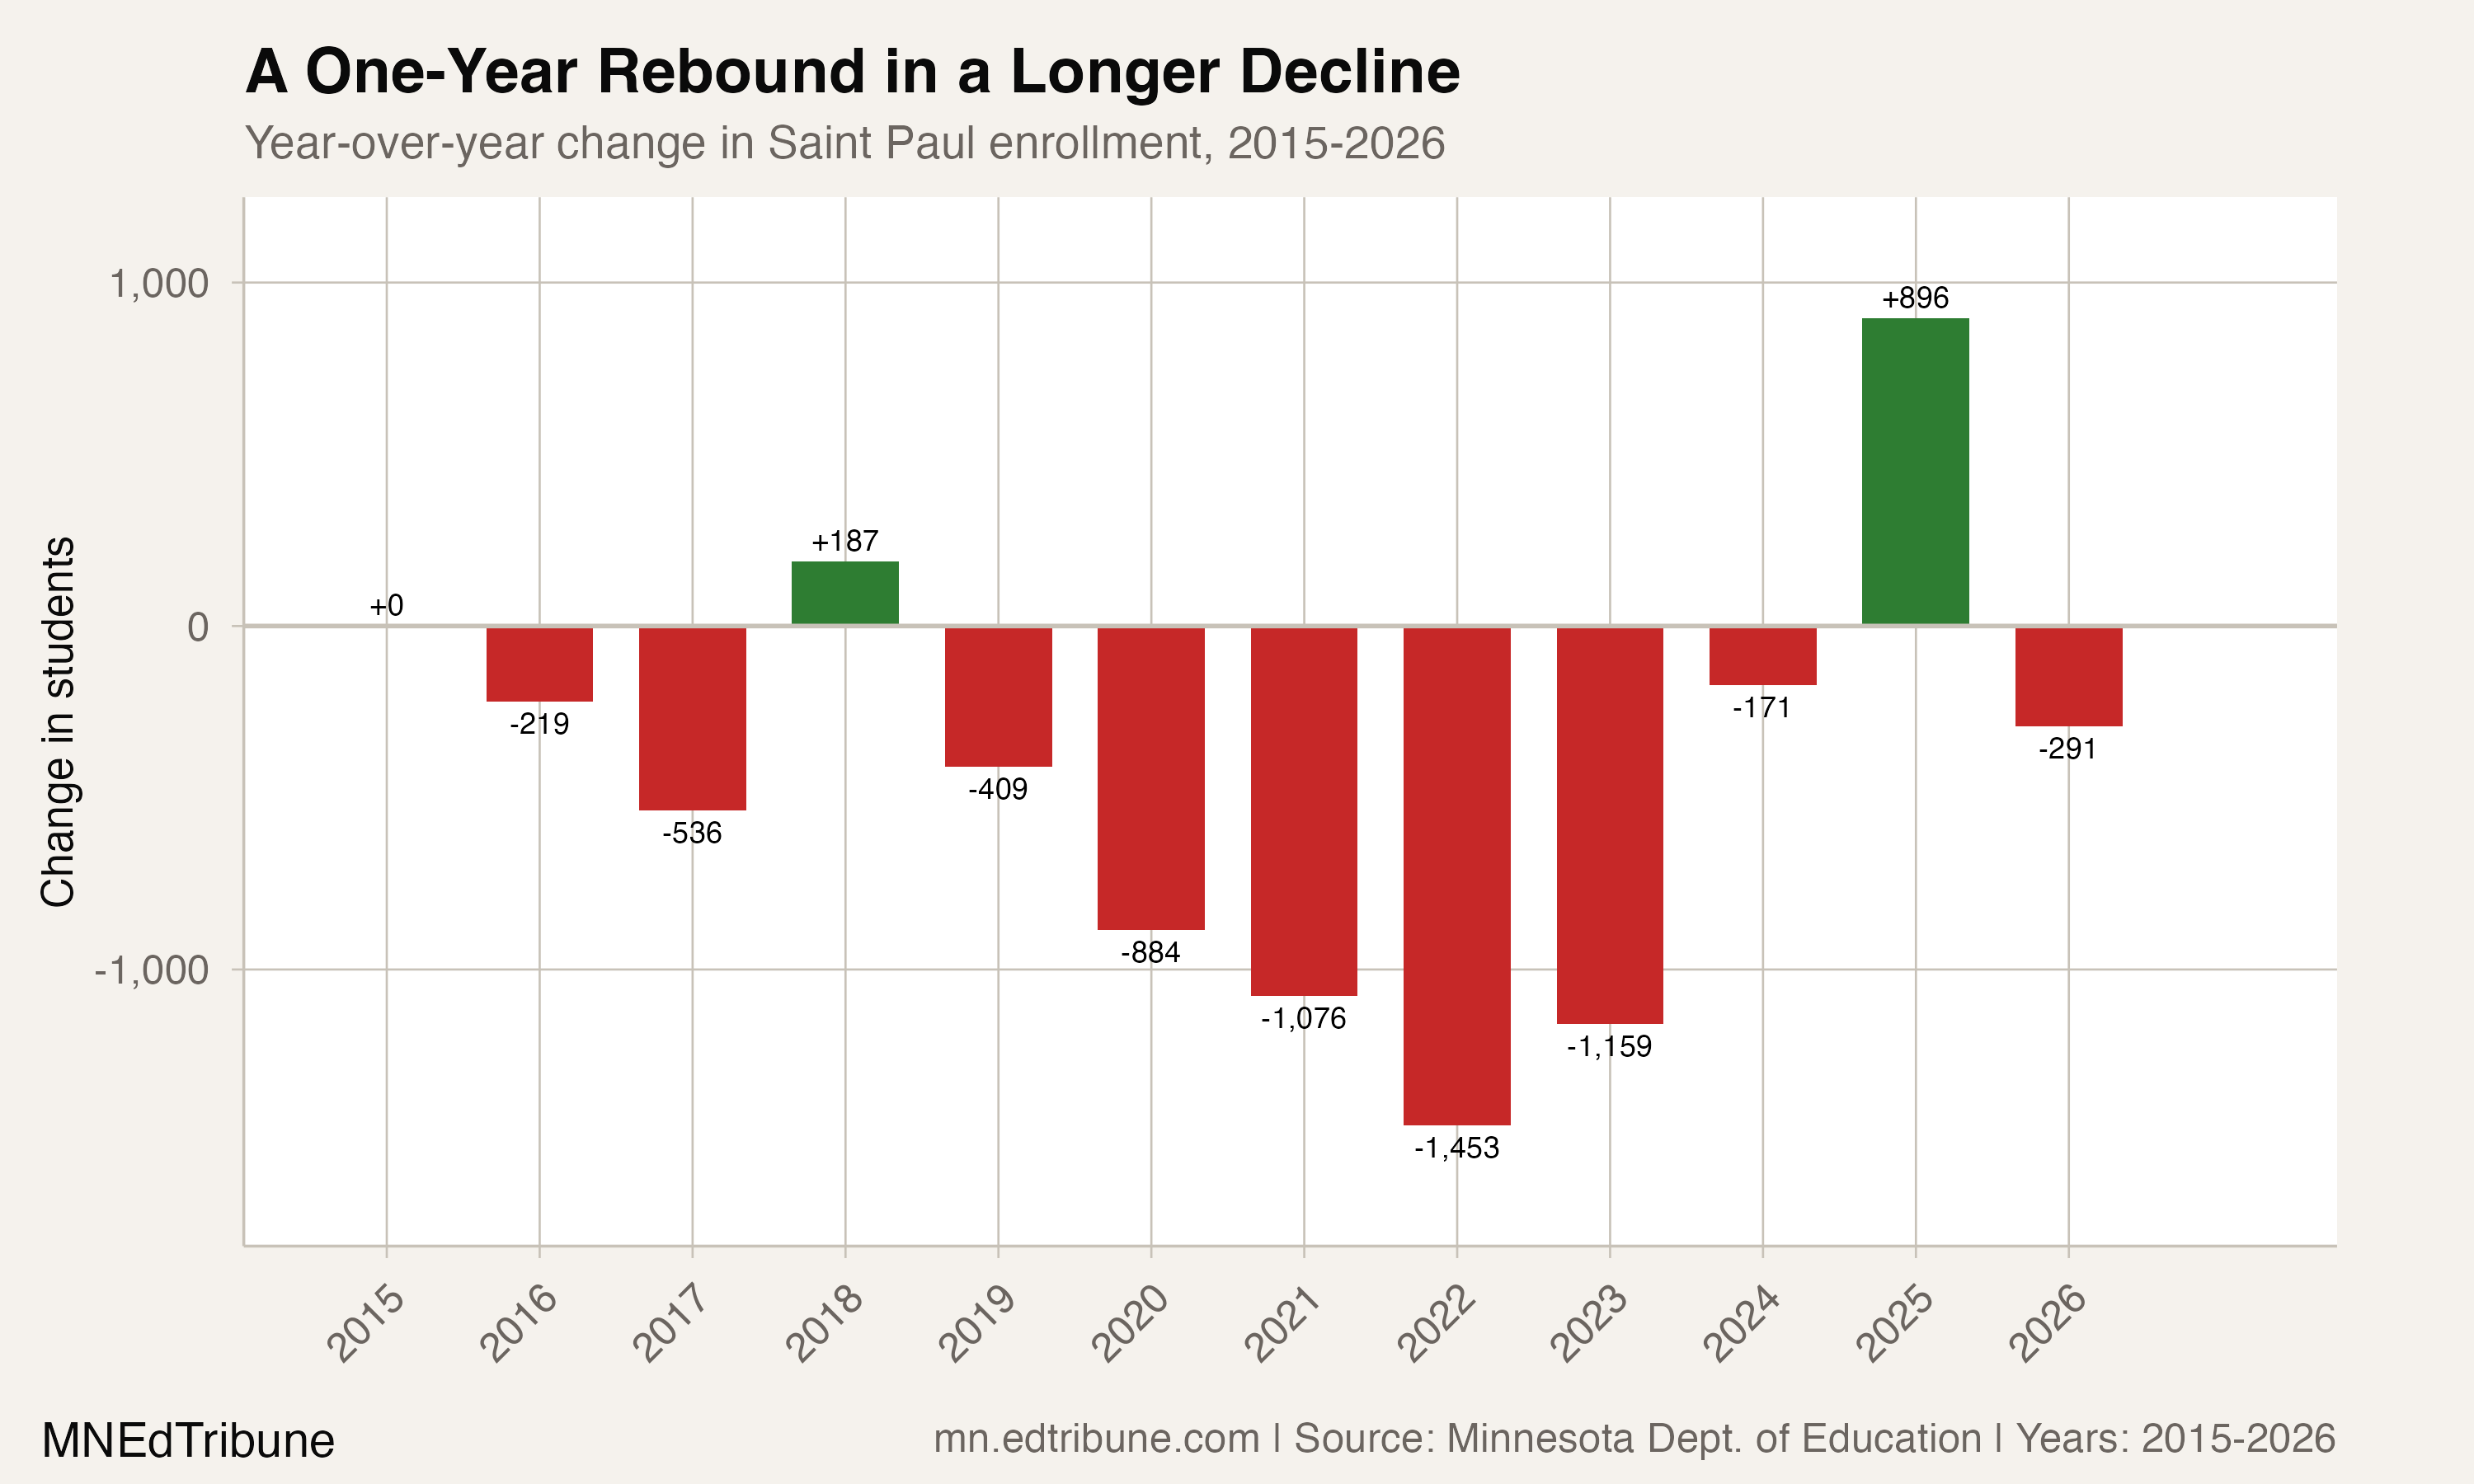
The rebound and reversal were not distributed evenly. Hispanic enrollment rose by 381 in 2025 and then fell by 225 in 2026. Asian enrollment rose by 28 and then fell by 249.
Sahan Journal's reporting on Saint Paul's language- and culture-focused schools offers suggestive context for the rebound. MinnPost's reporting on immigration-enforcement fears and the district's response is a competing explanation for part of the later Hispanic decline. Neither source establishes a causal link to the enrollment counts in the state data.
Two different enrollment questions
District enrollment and resident-student market share are not the same measure. Saint Paul Public Schools has emphasized that market share should count school-age residents who attend the district, rather than every student enrolled in a school physically located in the city. The district's board-initiated goals use that resident-student frame; the school board has also set a goal of increasing market share to 63% by 2029.
This article uses only the district-level enrollment records published by the Minnesota Department of Education. It does not use a resident-market-share denominator, and it does not infer how many Saint Paul residents attend charter, private or neighboring public schools.
That boundary matters. Saint Paul's racial balance describes the students enrolled in SPPS, not every school-age child in the city. The district's enrollment challenge is therefore twofold: preserving an unusually even mix while rebuilding the total number of students choosing the system.
Enrollment counts come from the Minnesota Department of Education's data and analytics resources.
Detailed code that reproduces the analysis and figures in this article is available exclusively to EdTribune subscribers.
Discussion
Sign in to join the discussion.
Loading comments...