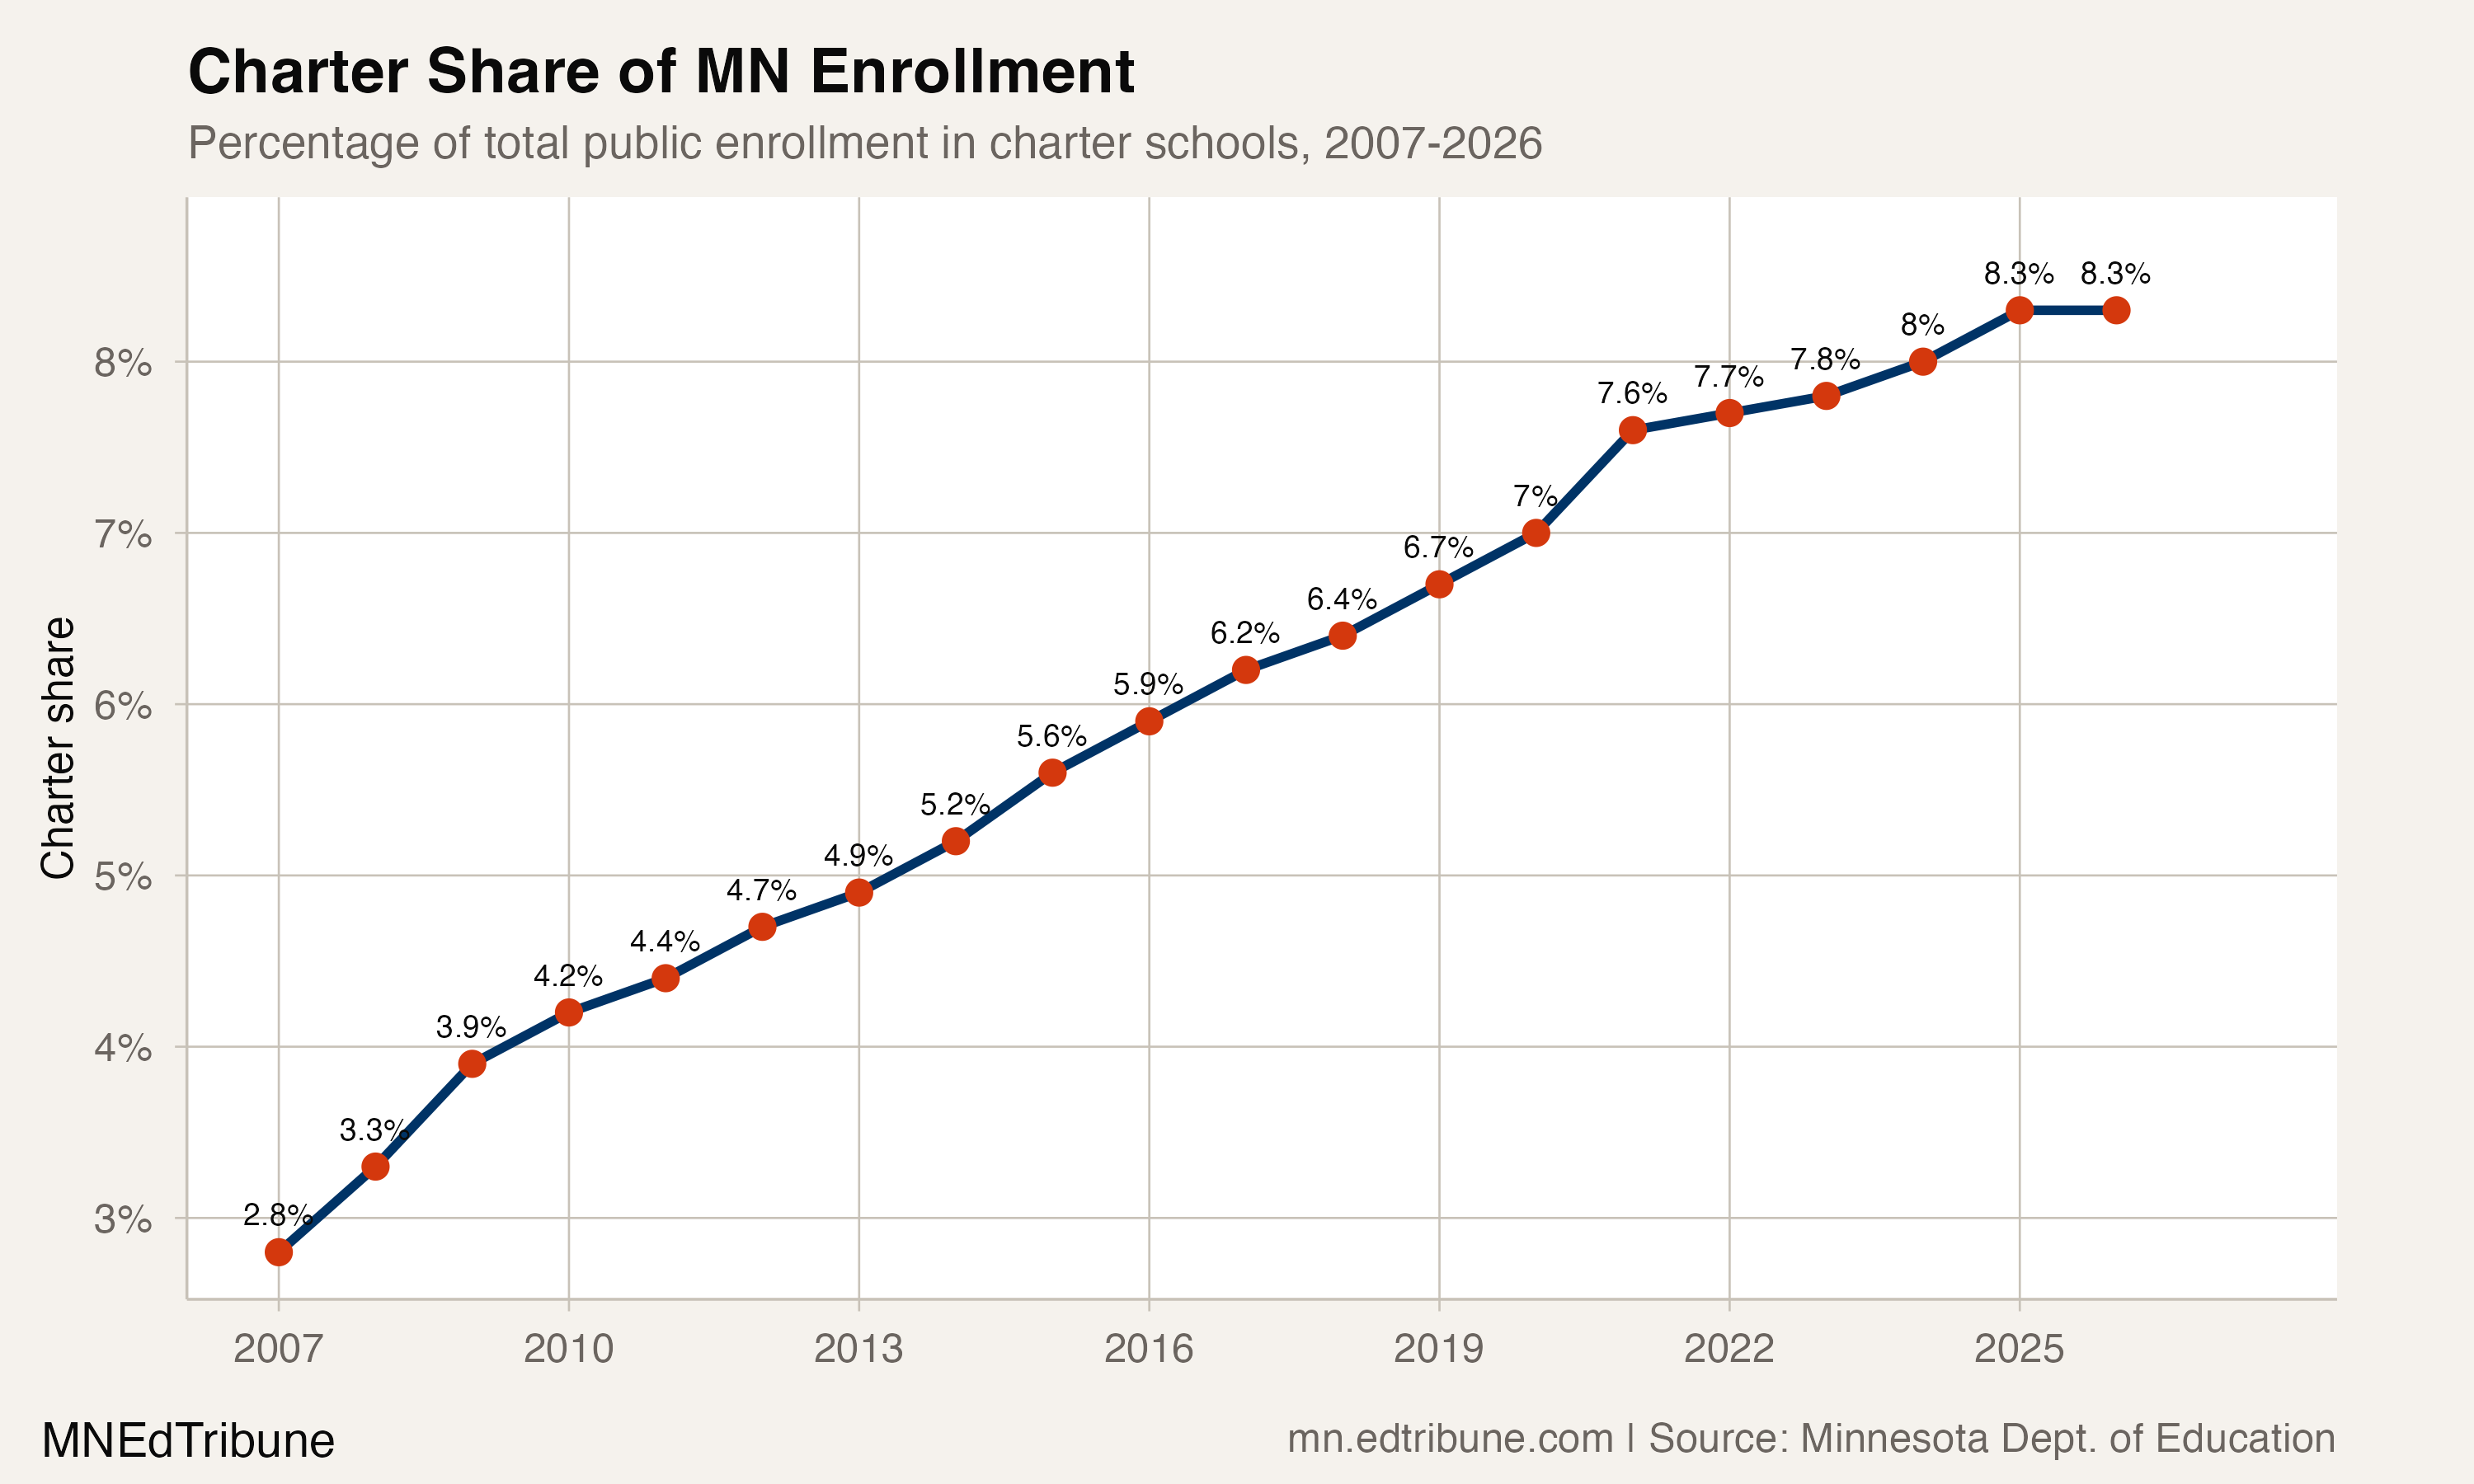
Minnesota's 2025-26 enrollment file reports 72,770 students in charter entities and 800,405 in traditional district entities. Charters held 8.3% of the combined published enrollment.
Different published composition
In 2025-26, Black students represented 31.8% of charter enrollment and 10.9% of traditional-district enrollment, a 2.9-to-1 ratio. Asian students represented 15.2% of charter enrollment and 6.4% of traditional enrollment, a 2.4-to-1 ratio.
White students represented 34.1% of charter enrollment and 61.7% of traditional enrollment. Hispanic students represented 11.4% and 11.6%, respectively.
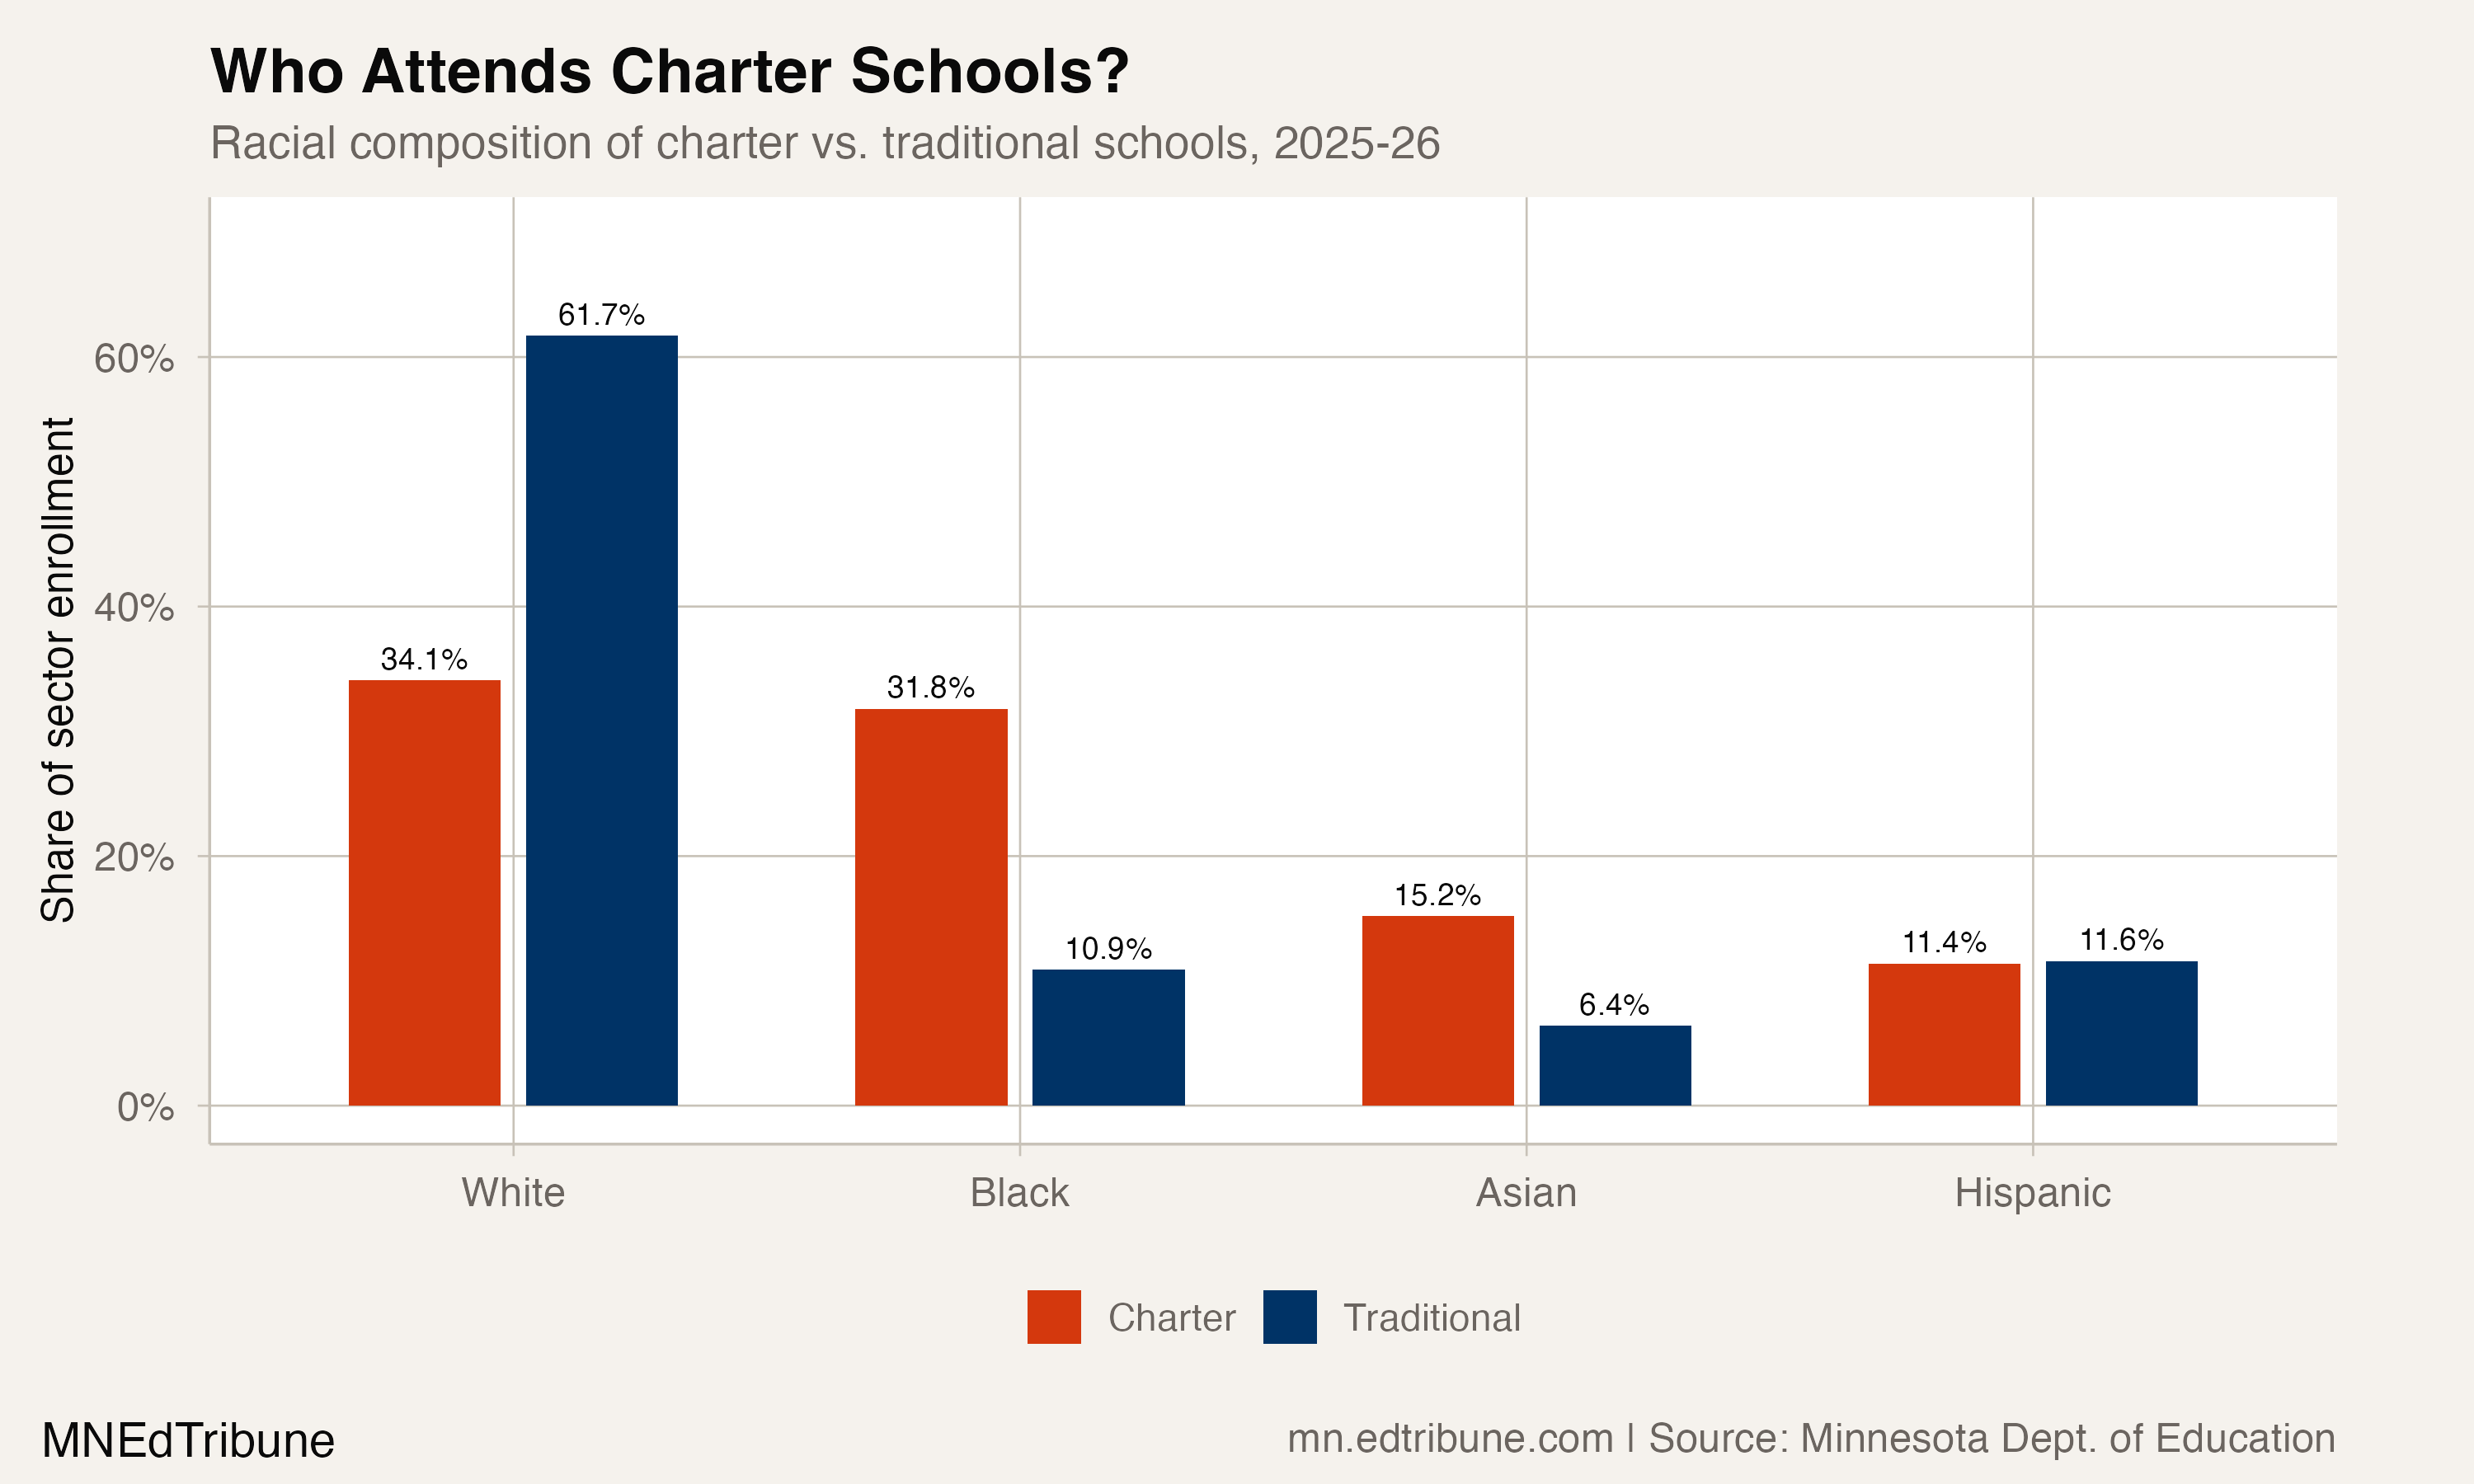
Every share uses the applicable published sector total as its denominator. The package categories describe enrollment; they do not establish why families enroll in either sector.
Charter enrollment grew
Charter enrollment rose from 23,701 students in 2006-07 to 72,770 in 2025-26, an increase of 49,069 students, or 207.0%. The charter share of combined enrollment rose from 2.8% to 8.3%.
Traditional-district enrollment moved from 816,861 to 800,405 across the same endpoints, a decline of 16,456 students, or 2.0%.
The sharpest displayed one-year divergence came in 2020-21, when traditional enrollment fell by 24,356 and charter enrollment increased by 3,236.
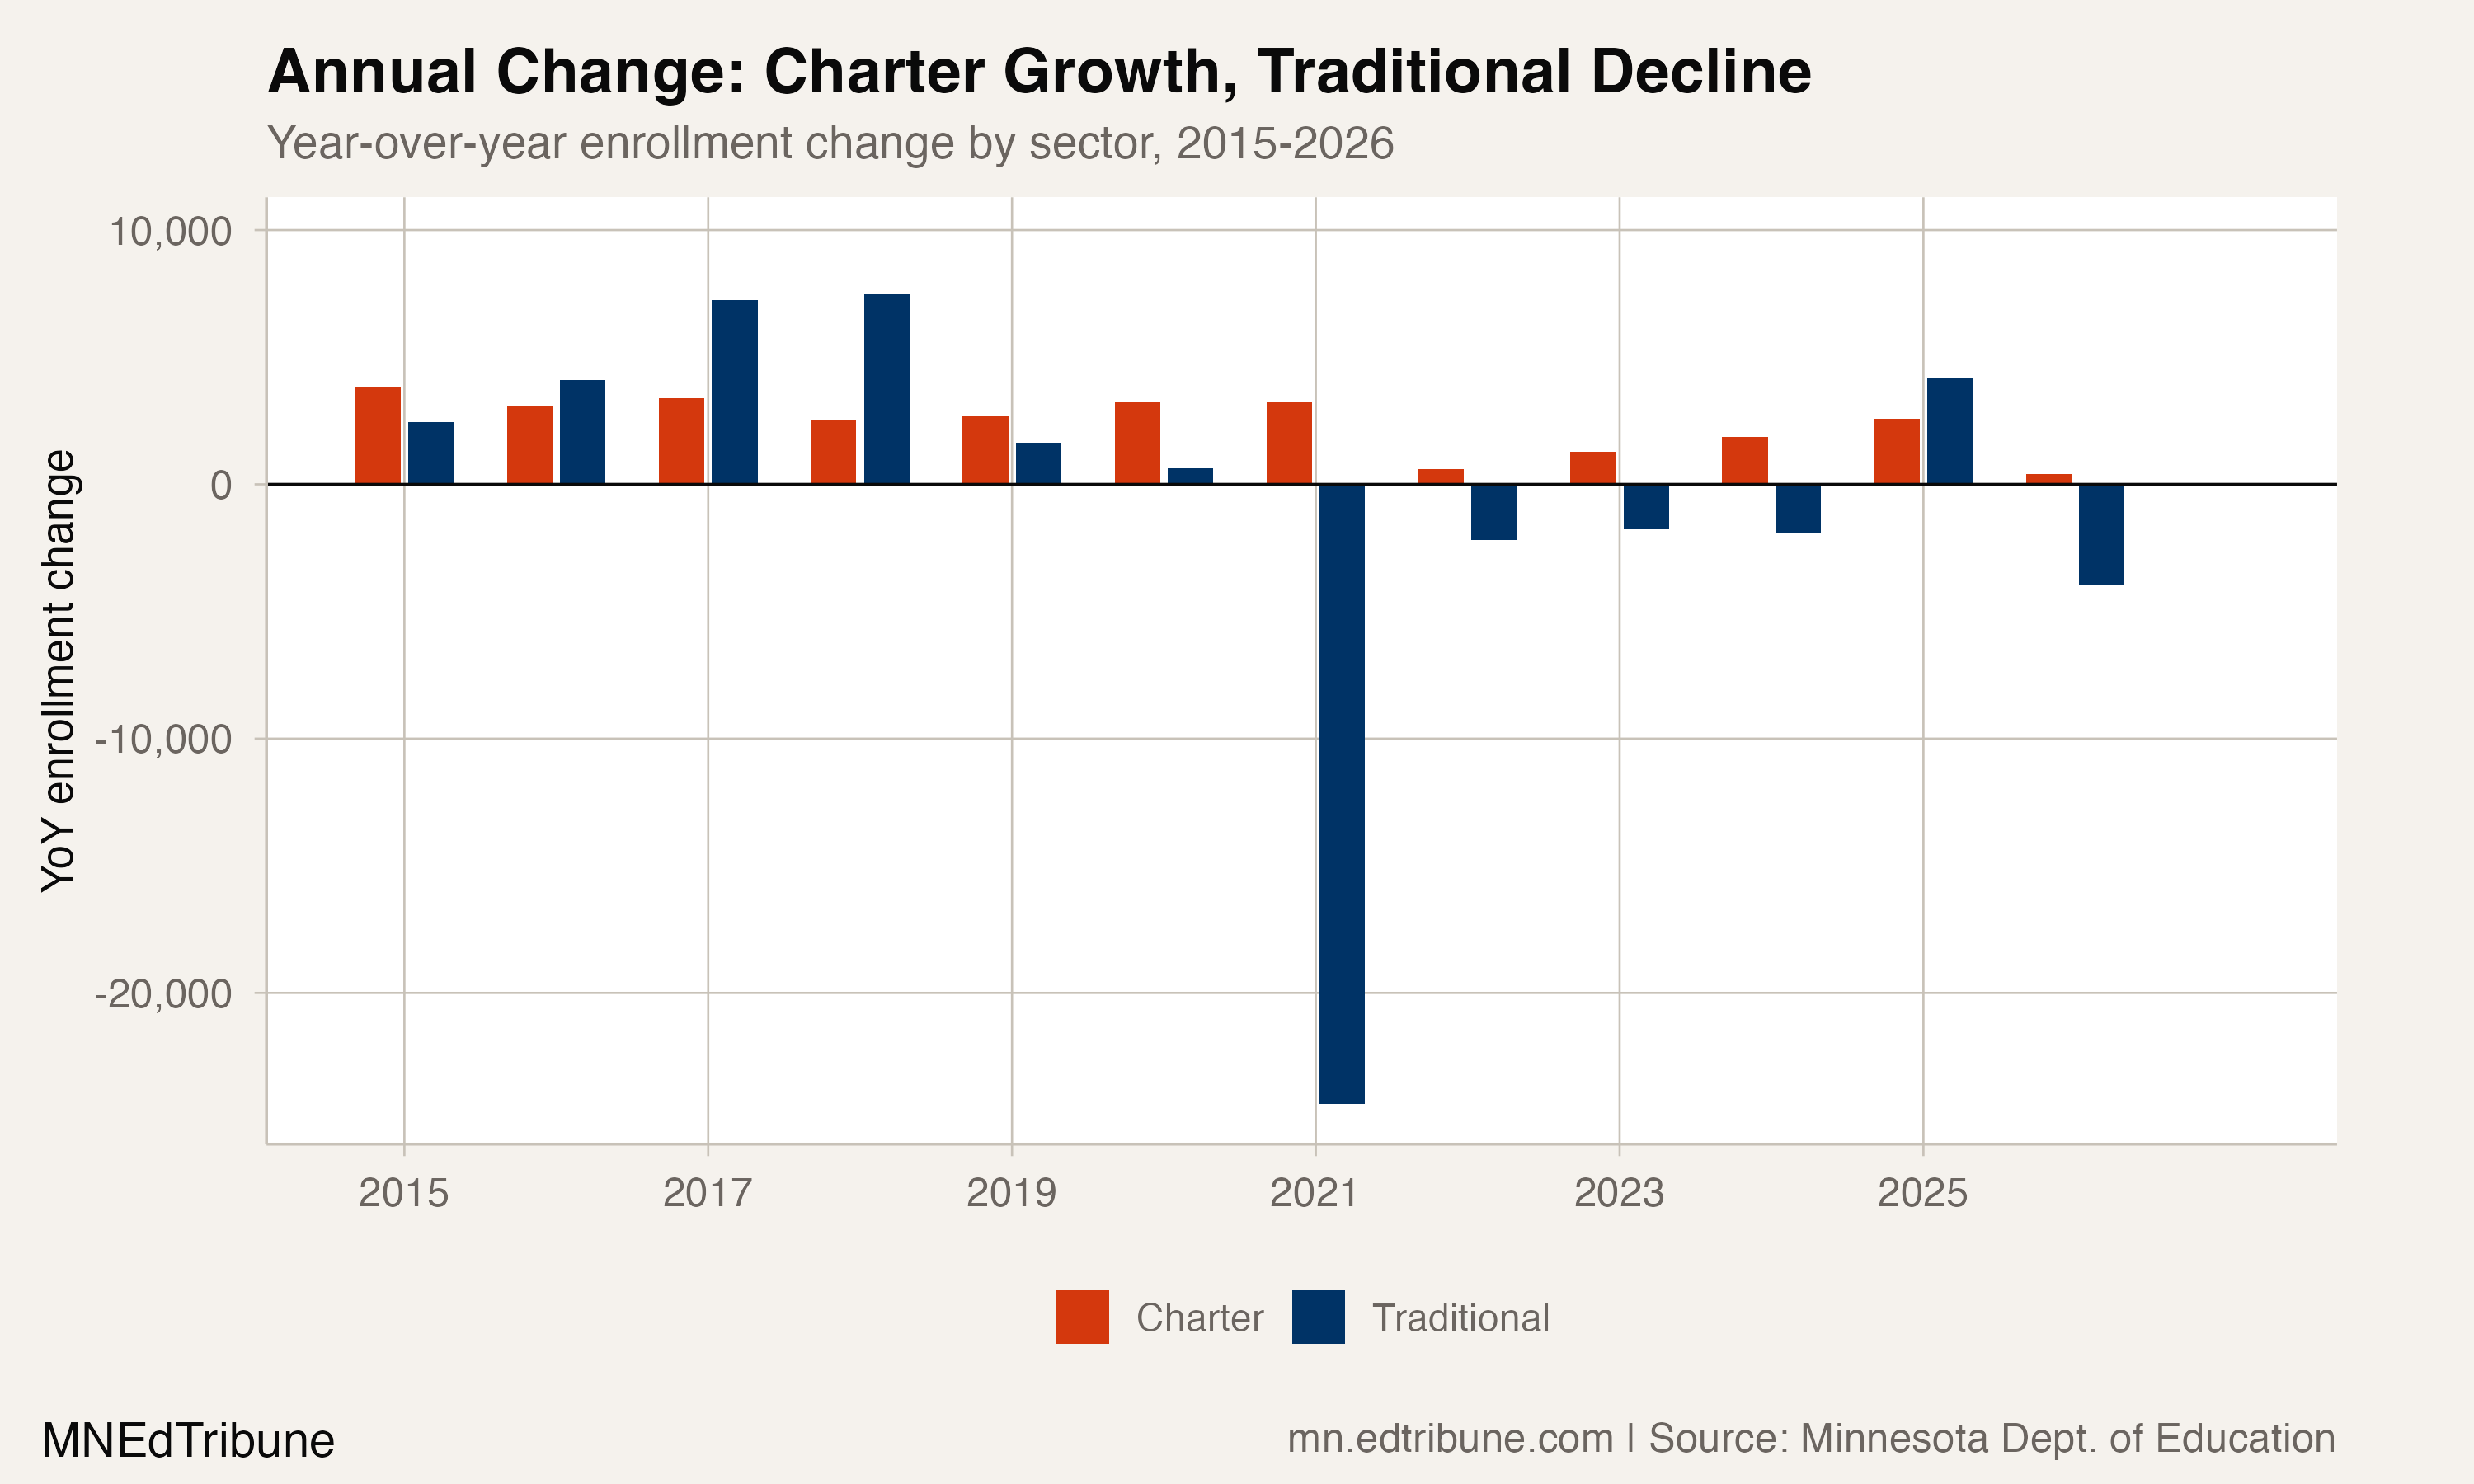
Charter growth slowed to 418 students in 2025-26. The number of charter entities also fell from 181 in 2023-24 to 169 in 2025-26.
The Black-share gap widened
The Black share of charter enrollment increased from 24.6% in 2013-14 to 31.8% in 2025-26. In traditional districts, it increased from 8.9% to 10.9%. The difference between the two sector shares widened from 15.7 to 20.9 percentage points, a 5.2-point increase.
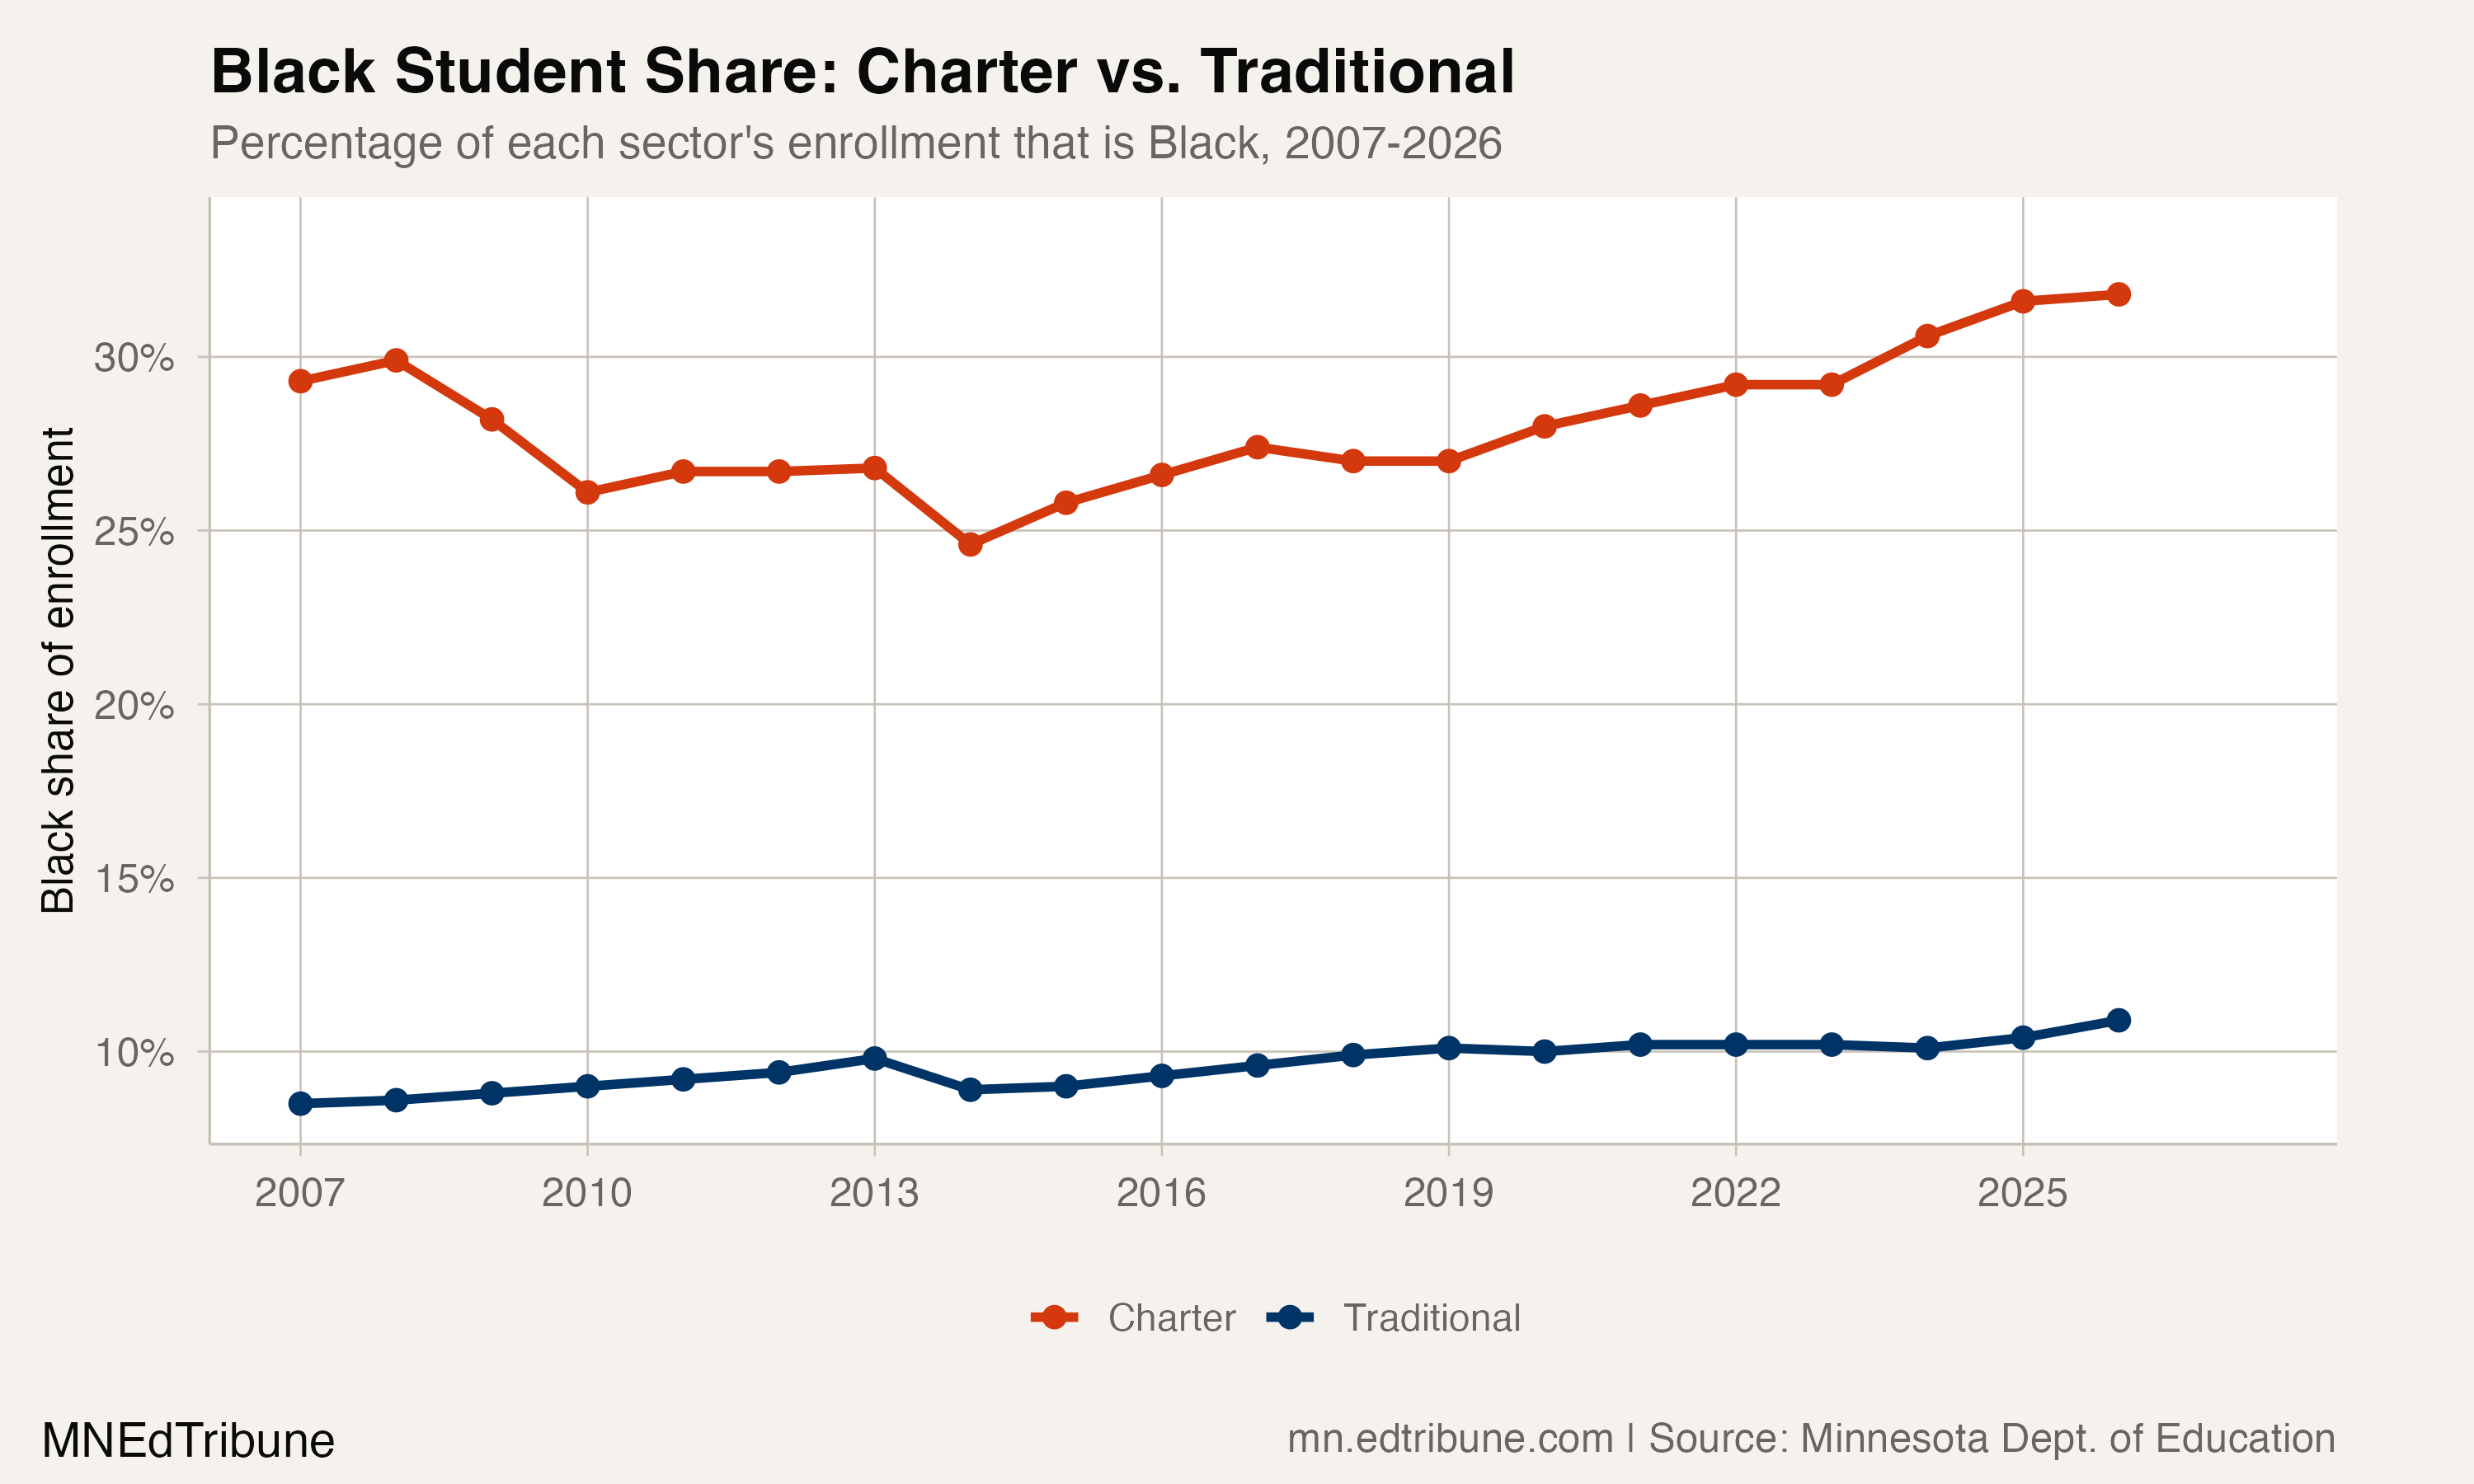
Black charter enrollment increased from 10,829 to 23,138 across those endpoints, a gain of 12,309 students or 113.7%. Traditional-district Black enrollment increased from 71,618 to 87,174, a gain of 15,556 or 21.7%.
These results are descriptive. The enrollment package does not measure family intent, school quality, academic outcomes, or the causes of the sector differences.
Detailed code that reproduces the analysis and figures in this article is available exclusively to EdTribune subscribers.
Discussion
Sign in to join the discussion.
Loading comments...