In this series: State Recovery | Racial Equity Chasm | Red Lake Crisis | Pequot Lakes Turnaround | Poverty-Absence Nexus | Minneapolis Volatile Trajectory | Districts at All-Time High | Consistent Attendance Leaders | Moorhead Escalating
Correction: This version restores the earlier Rochester report and adds Bloomington to the large-district comparison. Rochester's improvement since the subsequent high point remains, but the full available history does not show a return to its earlier attendance rate.
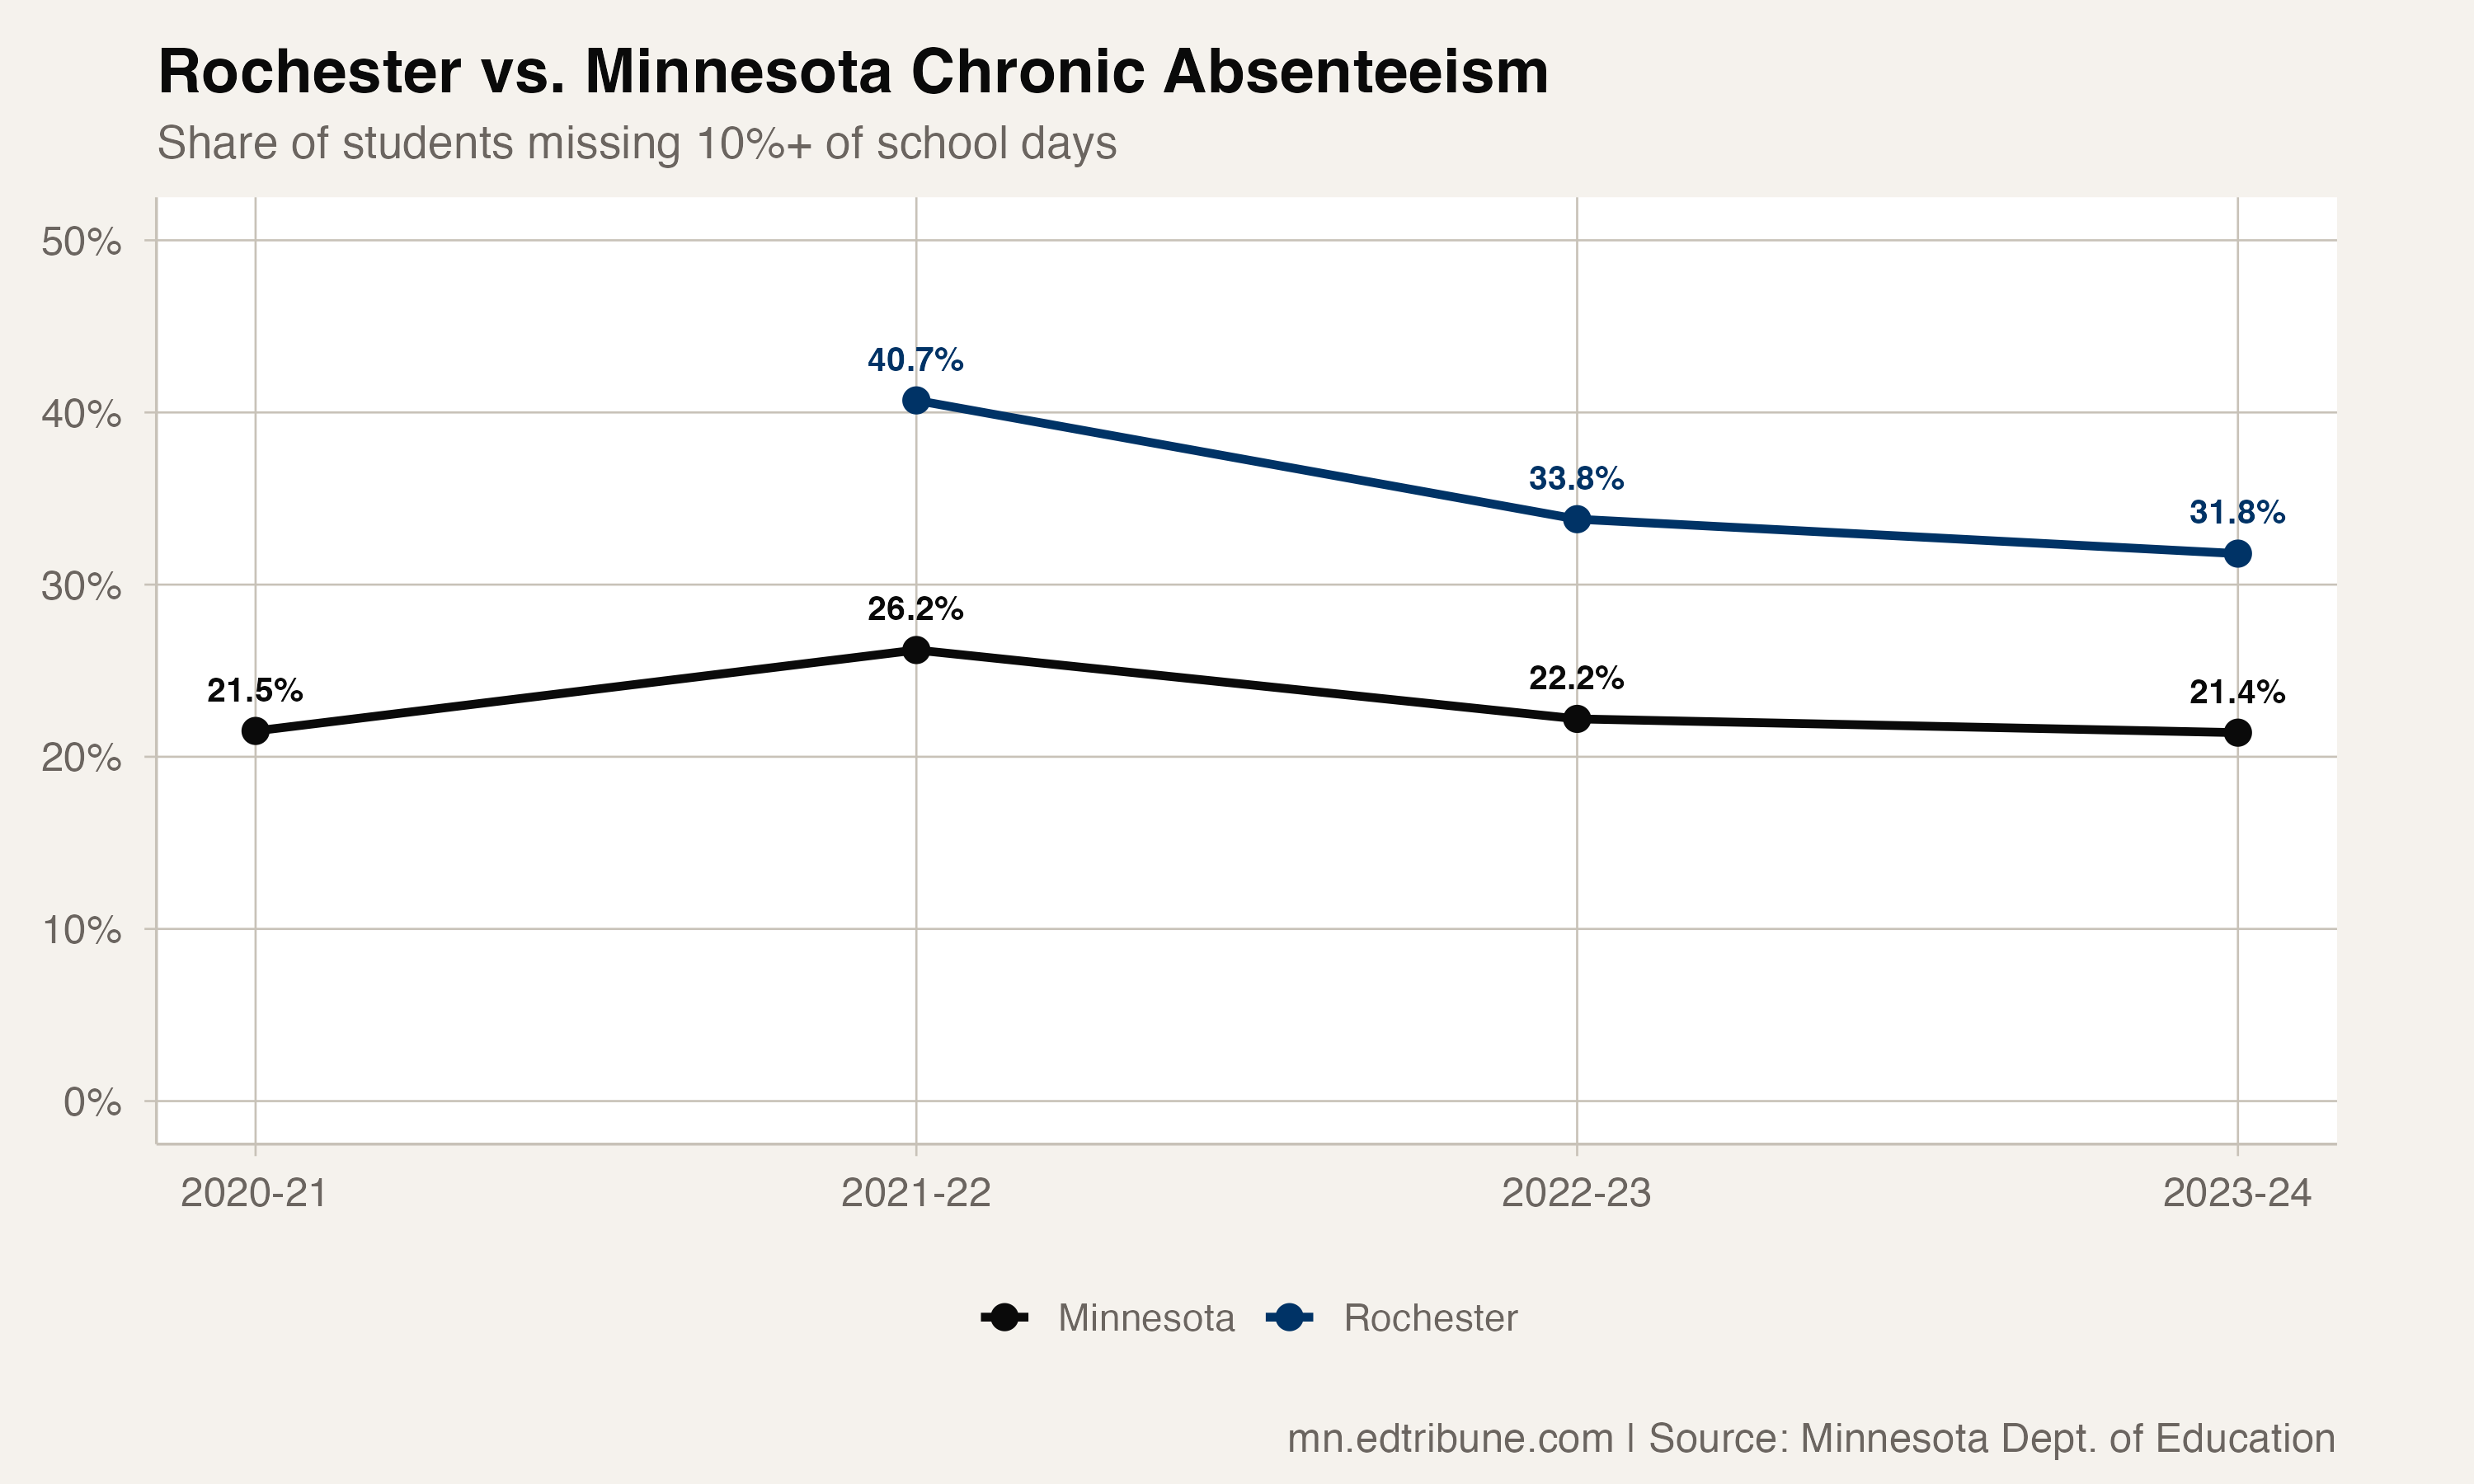
The chronic-absence rate in Rochester↗ET fell from 40.7% in the school year ending 2022 to 33.8% in 2023 and 31.8% in 2024. That was an 8.9-percentage-point improvement over two annual transitions.
Minnesota improved too, but by less. The statewide rate moved from 26.2% in 2022 to 22.2% in 2023 and 21.4% in 2024, a 4.8-point decline. Rochester's distance above the state consequently narrowed from 14.5 points to 10.4 points.
The remaining burden was still large. State records counted 5,507 chronically absent students among Rochester's 17,342 students in 2024.
The gap narrowed, not widened
| Year | Chronic Rate | Students Absent | Enrollment | Gap from State |
|---|---|---|---|---|
| 2020-21 | 23.6% | 4,121 | 17,474 | +2.1 pp |
| 2021-22 | 40.7% | 7,169 | 17,617 | +14.5 pp |
| 2022-23 | 33.8% | 5,905 | 17,492 | +11.6 pp |
| 2023-24 | 31.8% | 5,507 | 17,342 | +10.4 pp |
The recent comparison shows improvement after the 2021-22 high: Rochester's rate fell faster than Minnesota's, and its gap narrowed by 4.1 points. The longer record sets a different baseline. Rochester reported 23.6% in 2020-21, so its 2023-24 rate remained 8.2 points above that earlier level. The district-state gap was 2.1 points in the first report and 10.4 points in the last.
Inside the schools
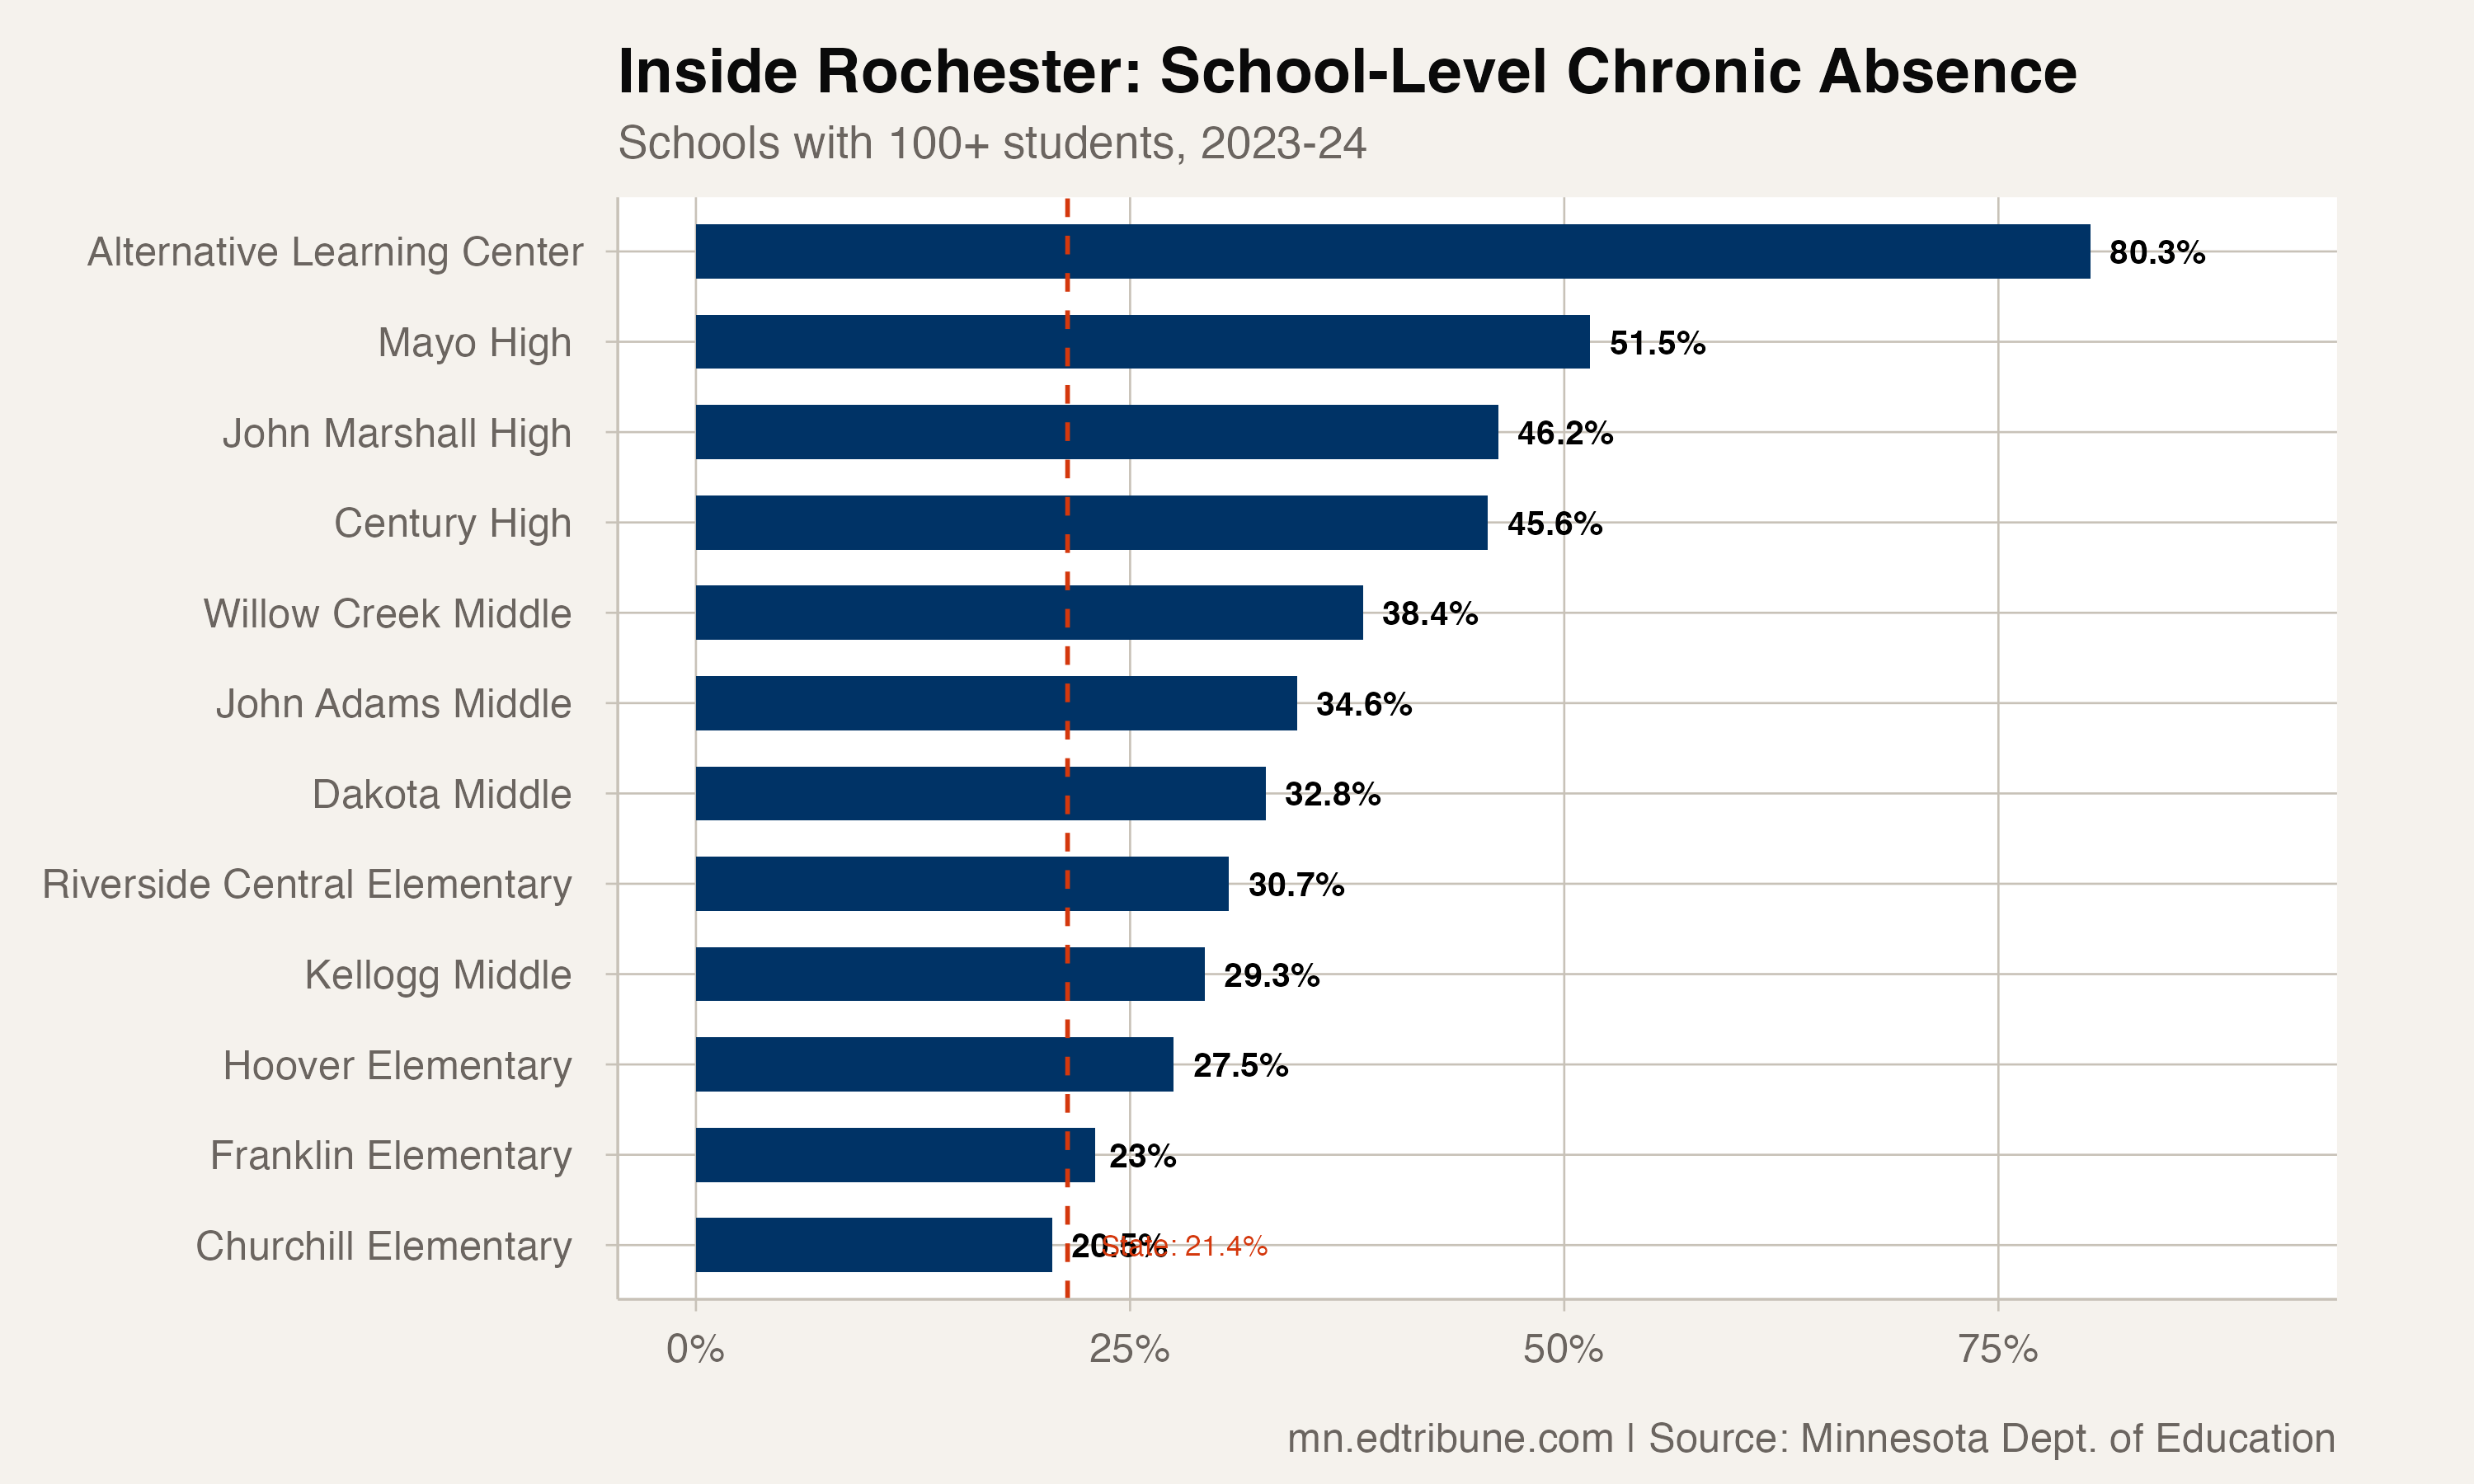
Rochester's school-level results varied substantially. Mayo High School recorded a 51.5% chronic-absence rate, with 937 of 1,820 students counted as chronically absent. The Rochester Alternative Learning Center recorded 302 chronically absent students among 376 enrolled, an 80.3% rate.
The school comparison uses matching published school enrollment totals within Rochester. The P-TECH attendance record had no matching enrollment total and is excluded from rate comparisons. The available records show a wide spread among schools with valid totals. They do not, on their own, identify why students missed school or whether the same causes operated across schools.
Among large-district peers
Rochester's 31.8% rate was the highest among 15 Minnesota districts with at least 10,000 students and valid published totals in 2023-24. These districts accounted for 32.2% of the published statewide enrollment total. Minneapolis was just below Rochester at 31.7%, followed by Osseo↗ET at 27.6% and Saint Paul↗ET at 25.0%.
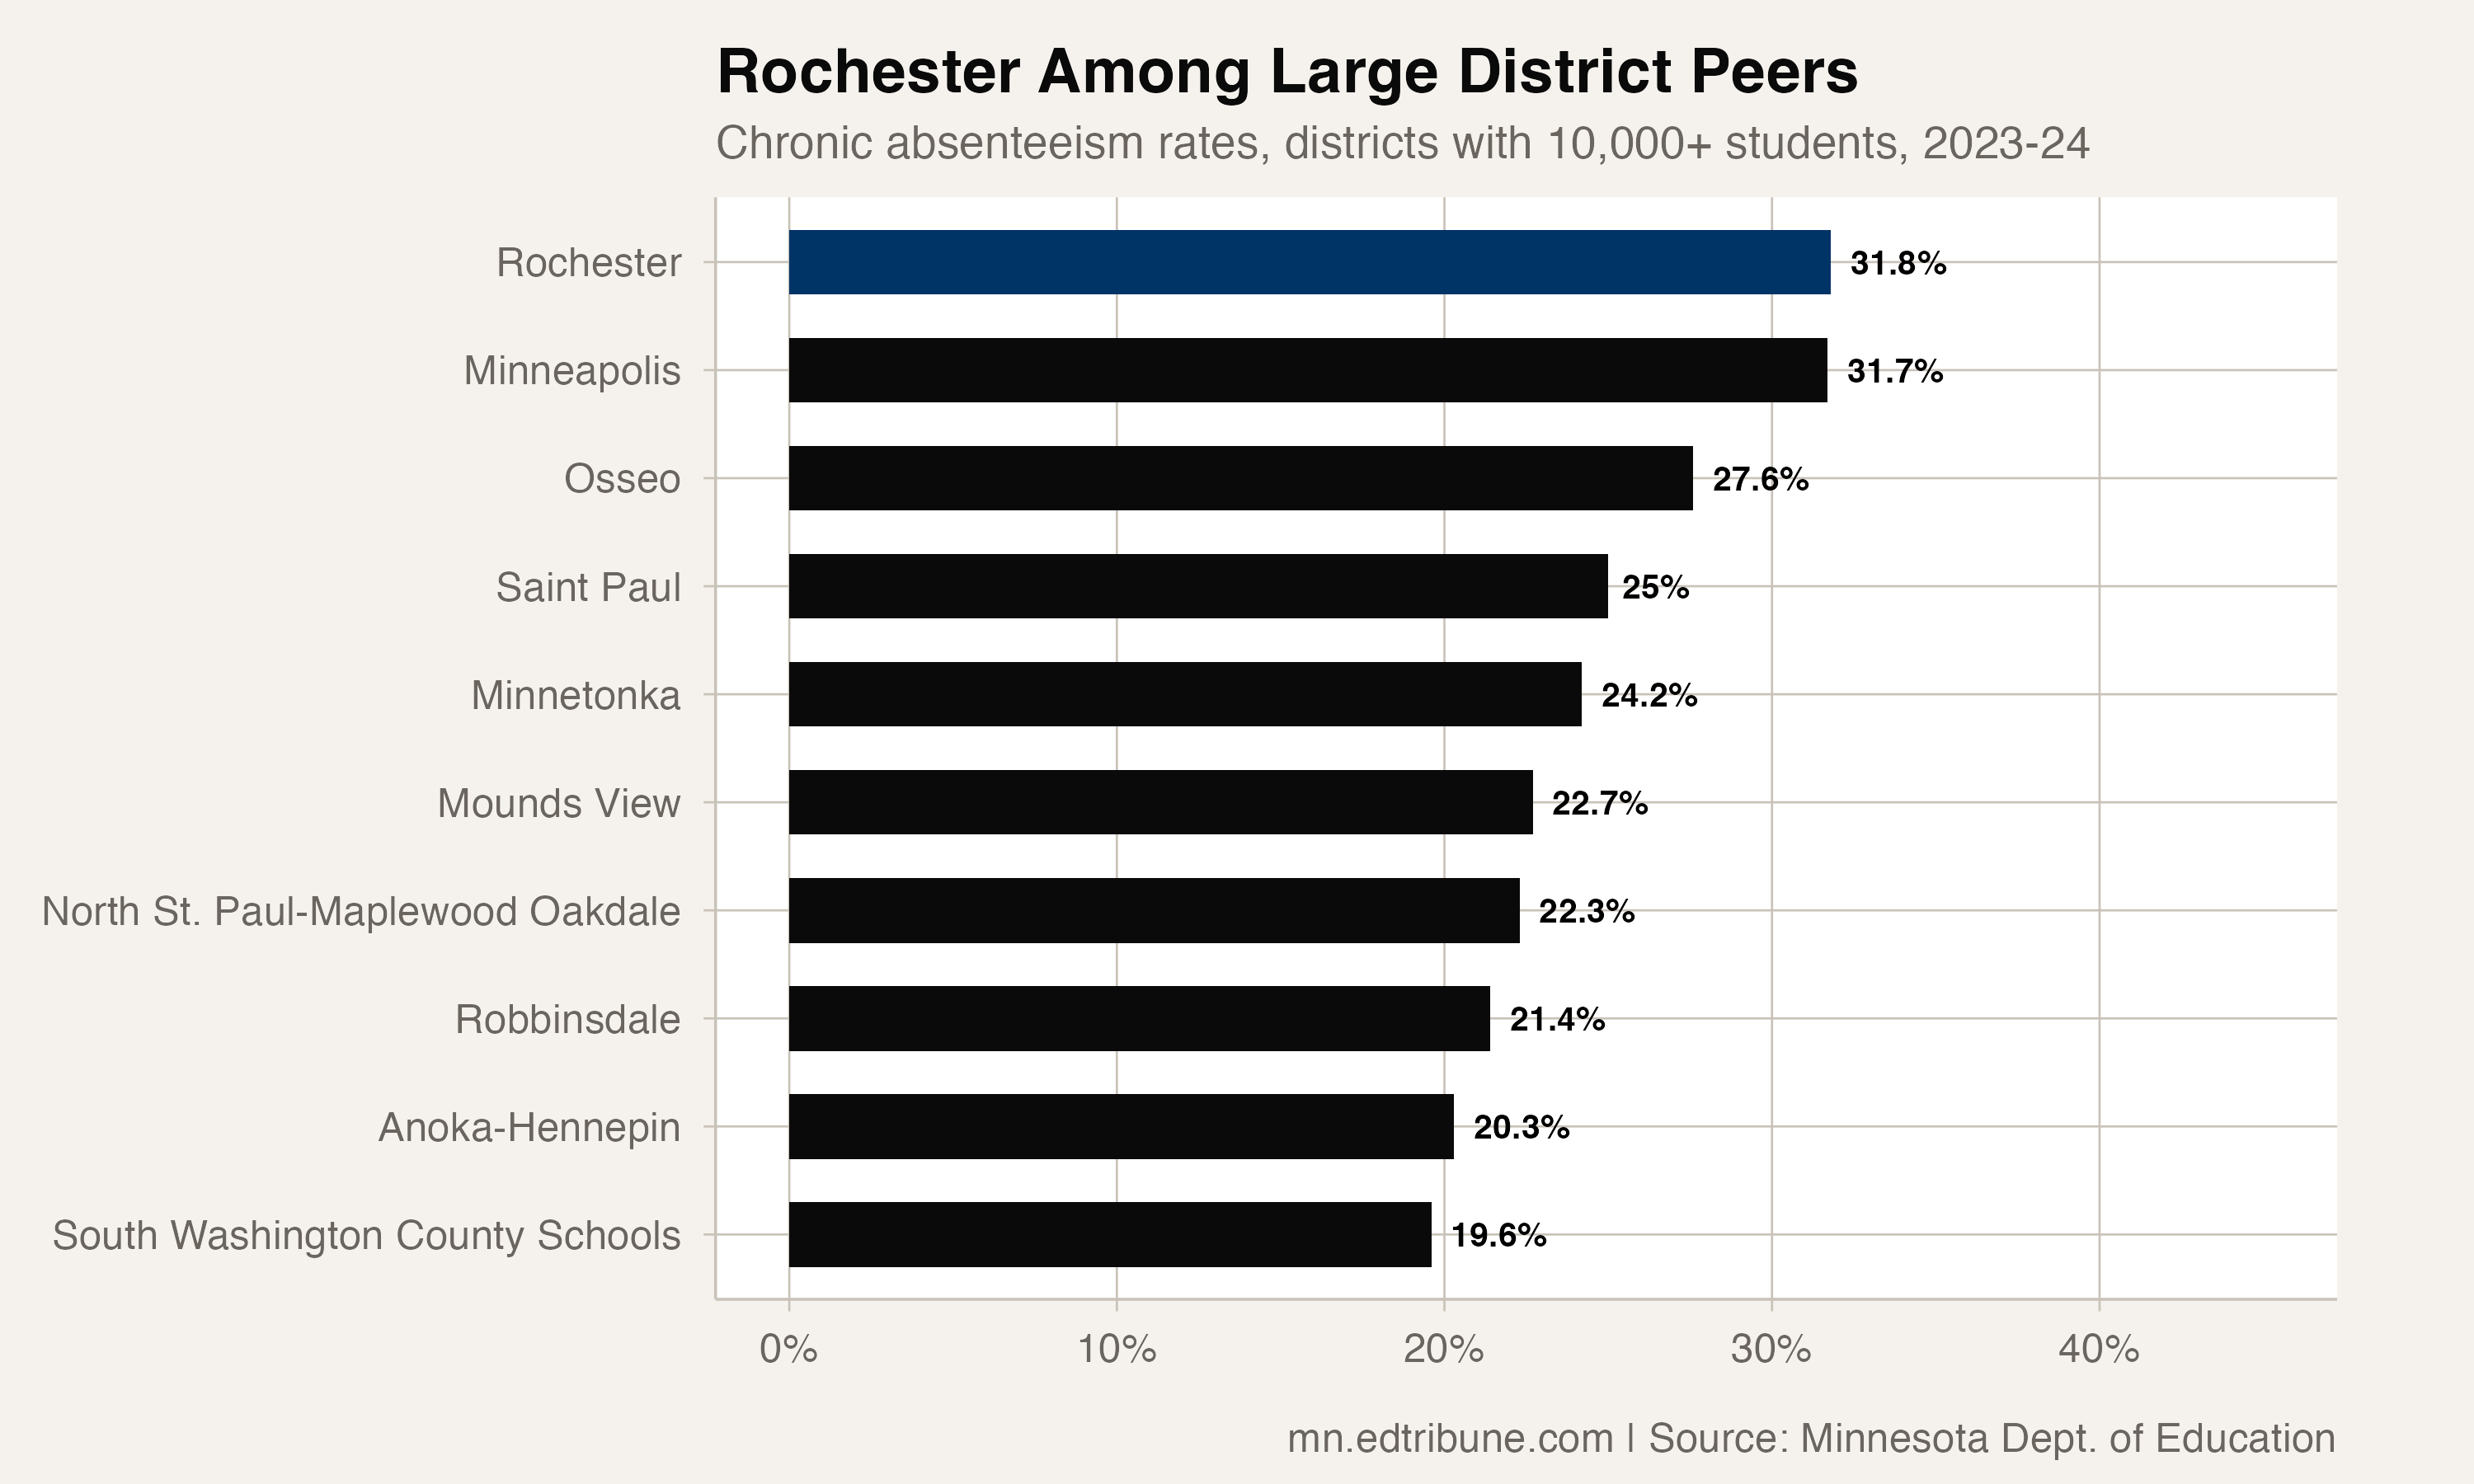
The size filter makes the comparison consistent, but it does not control for student composition, local conditions, reporting practice, or intervention strategy. The data support a rank within that defined universe, not a causal explanation for it.
What the records do not explain
The state files report counts and enrollment but do not identify the mechanisms behind Rochester's improvement or its still-elevated rate. Transportation, health, housing, school climate, and attendance interventions cannot be separated with these aggregate records.
The verified conclusion is therefore narrower: Rochester improved faster than Minnesota from 2022 through 2024, while its 2024 rate remained the highest in the analysis's large-district comparison group.
Analysis uses chronic-absence and enrollment files from the Minnesota Department of Education, covering school years ending 2021 through 2024. Rates divide published chronic-absence counts by published enrollment totals.
Detailed code that reproduces the analysis and figures in this article is available exclusively to EdTribune subscribers.
Discussion
Sign in to join the discussion.
Loading comments...