In this series: State Recovery | Racial Equity Chasm | Red Lake Crisis | Rochester's Stubborn Rate | Pequot Lakes Turnaround | Minneapolis Volatile Trajectory | Districts at All-Time High | Consistent Attendance Leaders | Moorhead Escalating
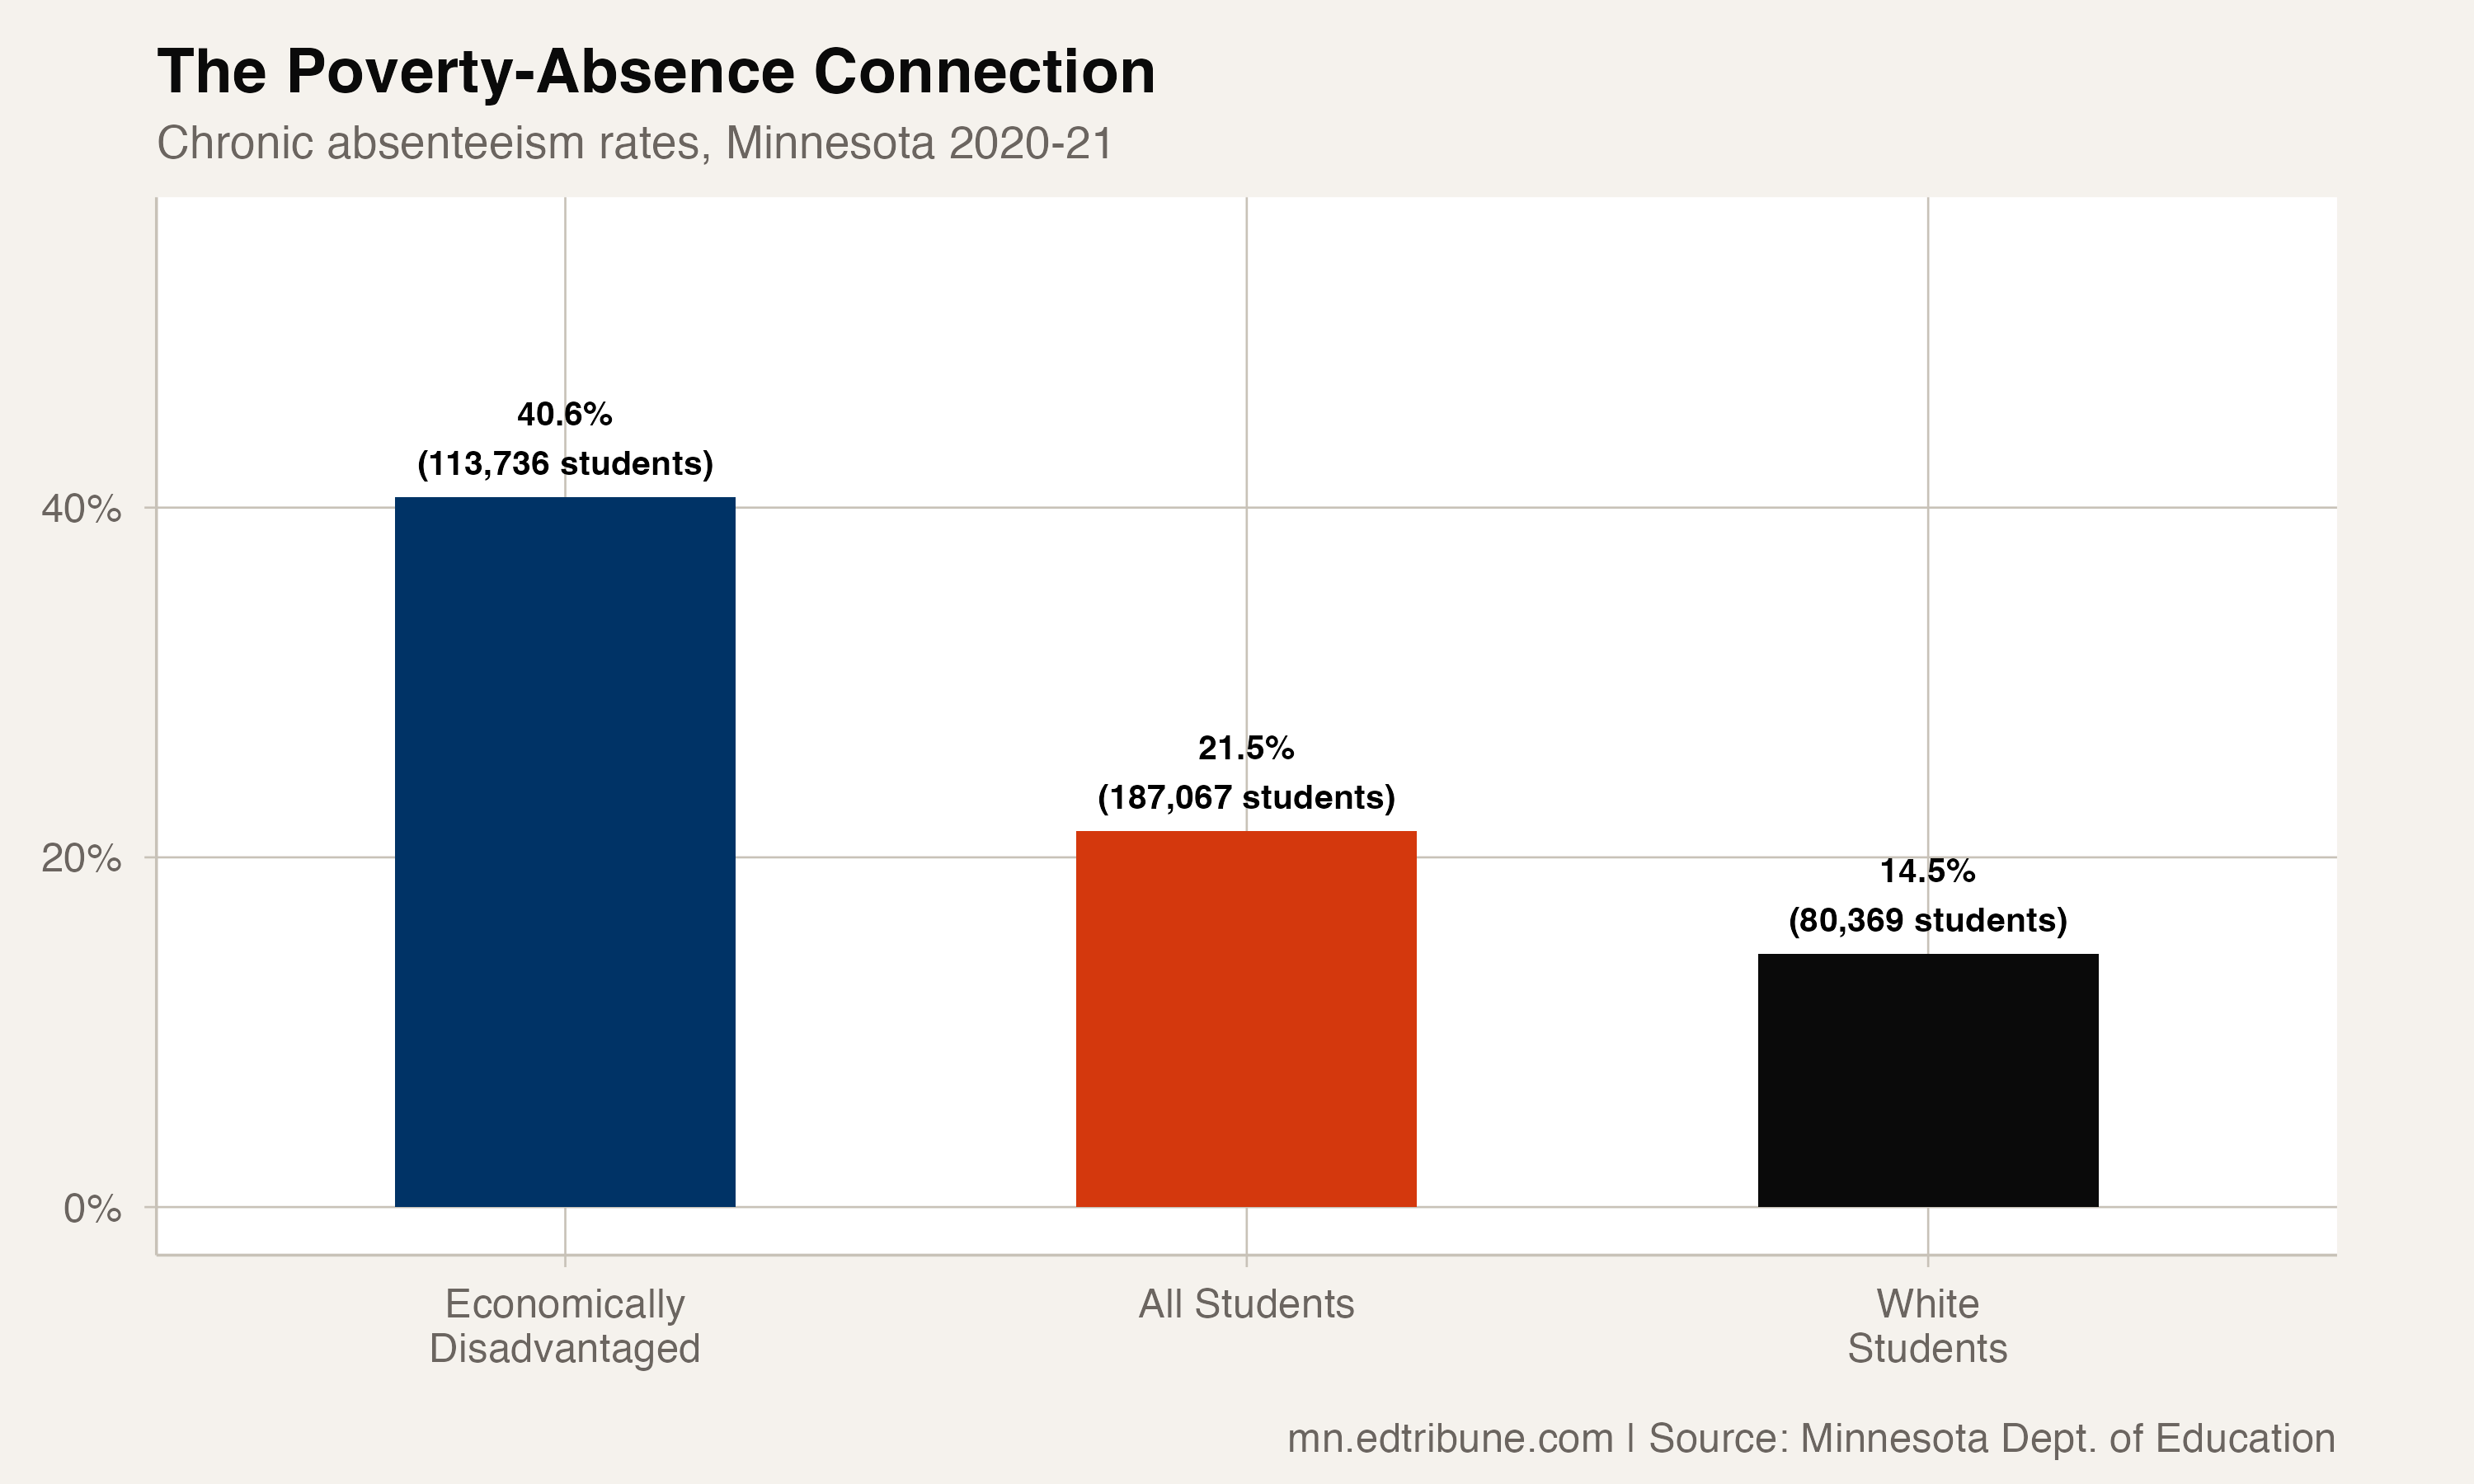
In the 2020-21 school year, 40.6% of Minnesota students eligible for free or reduced-price lunch were chronically absent. More than four in ten of the state's economically disadvantaged students missed 10% or more of the school year, the threshold used in the Minnesota Department of Education's attendance data.
The number was 113,736 students, more than three times the 34,928 students enrolled in St. Paul Public School District that year.
The economically disadvantaged rate was 19.1 percentage points above the statewide average. White students had a 14.5% chronic absence rate, putting the gap at 26.1 points. The economically disadvantaged rate was 2.80 times the white-student rate.
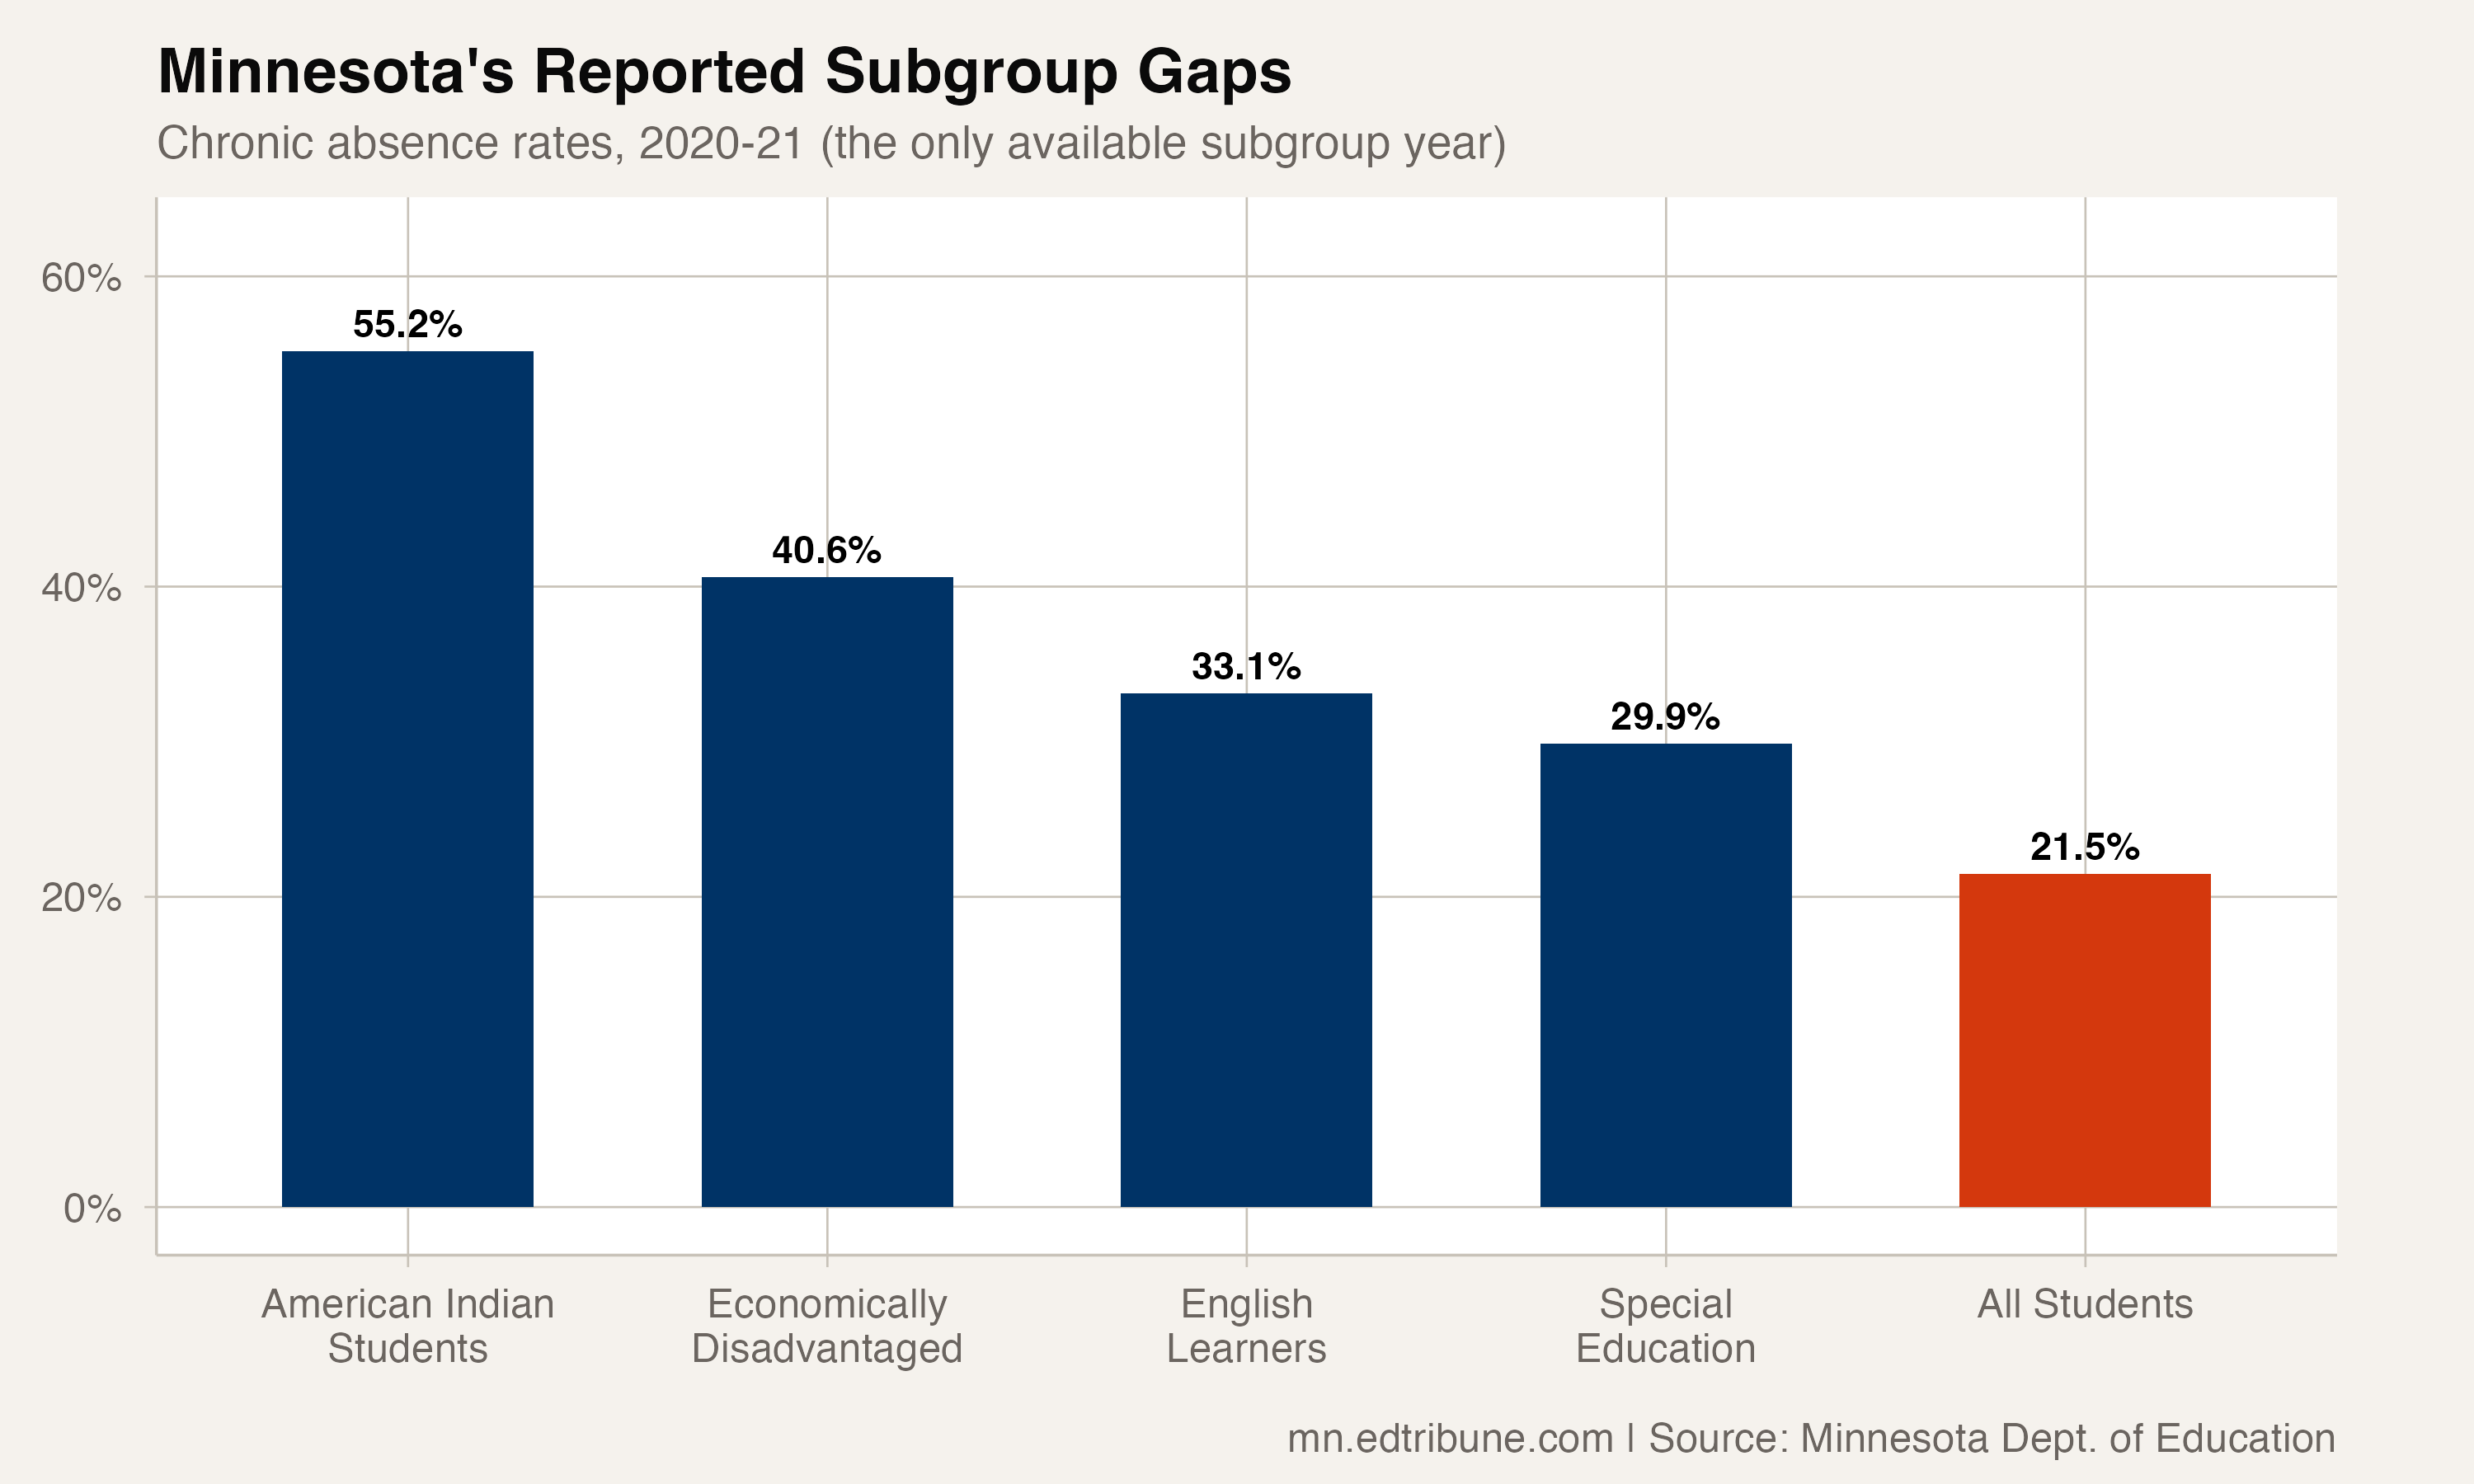
American Indian students had the largest reported subgroup gap in the 2020-21 file: a 55.2% chronic absence rate, 33.7 points above the statewide average. That comparison is possible because the current enrollment file includes a published American Indian denominator for the year.
What the attendance file can and cannot say
Minnesota's attendance file reports counts, not causes. It records how many students in each group missed 10% or more of the school year, but it does not identify why students missed school or establish that poverty, language, disability status or another mechanism produced the absence.
The data does establish the size of the reported subgroup differences:
| Student group | Chronic rate | Students absent | Gap from average |
|---|---|---|---|
| American Indian | 55.2% | 8,327 | +33.7 pp |
| Economically disadvantaged | 40.6% | 113,736 | +19.1 pp |
| English learners | 33.1% | 24,279 | +11.6 pp |
| Special education | 29.9% | 43,468 | +8.4 pp |
| All students | 21.5% | 187,067 | -- |
English learners
English learners were chronically absent at 33.1%, with 24,279 of 73,442 identified students missing regular attendance. That is 11.6 points above the statewide average.
Statewide English learner enrollment rose by 7,088 students between 2023-24 and 2024-25. In 2025-26, English learners made up 47.5% of Columbia Heights Public School District's enrollment.
The attendance file does not report why English learners missed more school, and it carries no measure of language access, family circumstance or school communication practice. Those explanations are outside this data.
Special education
Special education students were chronically absent at 29.9%, 8.4 points above the overall rate. That represents 43,468 students receiving special education services who missed 10% or more of the school year.
In 2025-26, special education students accounted for 19.5% of Minnesota's published enrollment.
Carrying more than their share
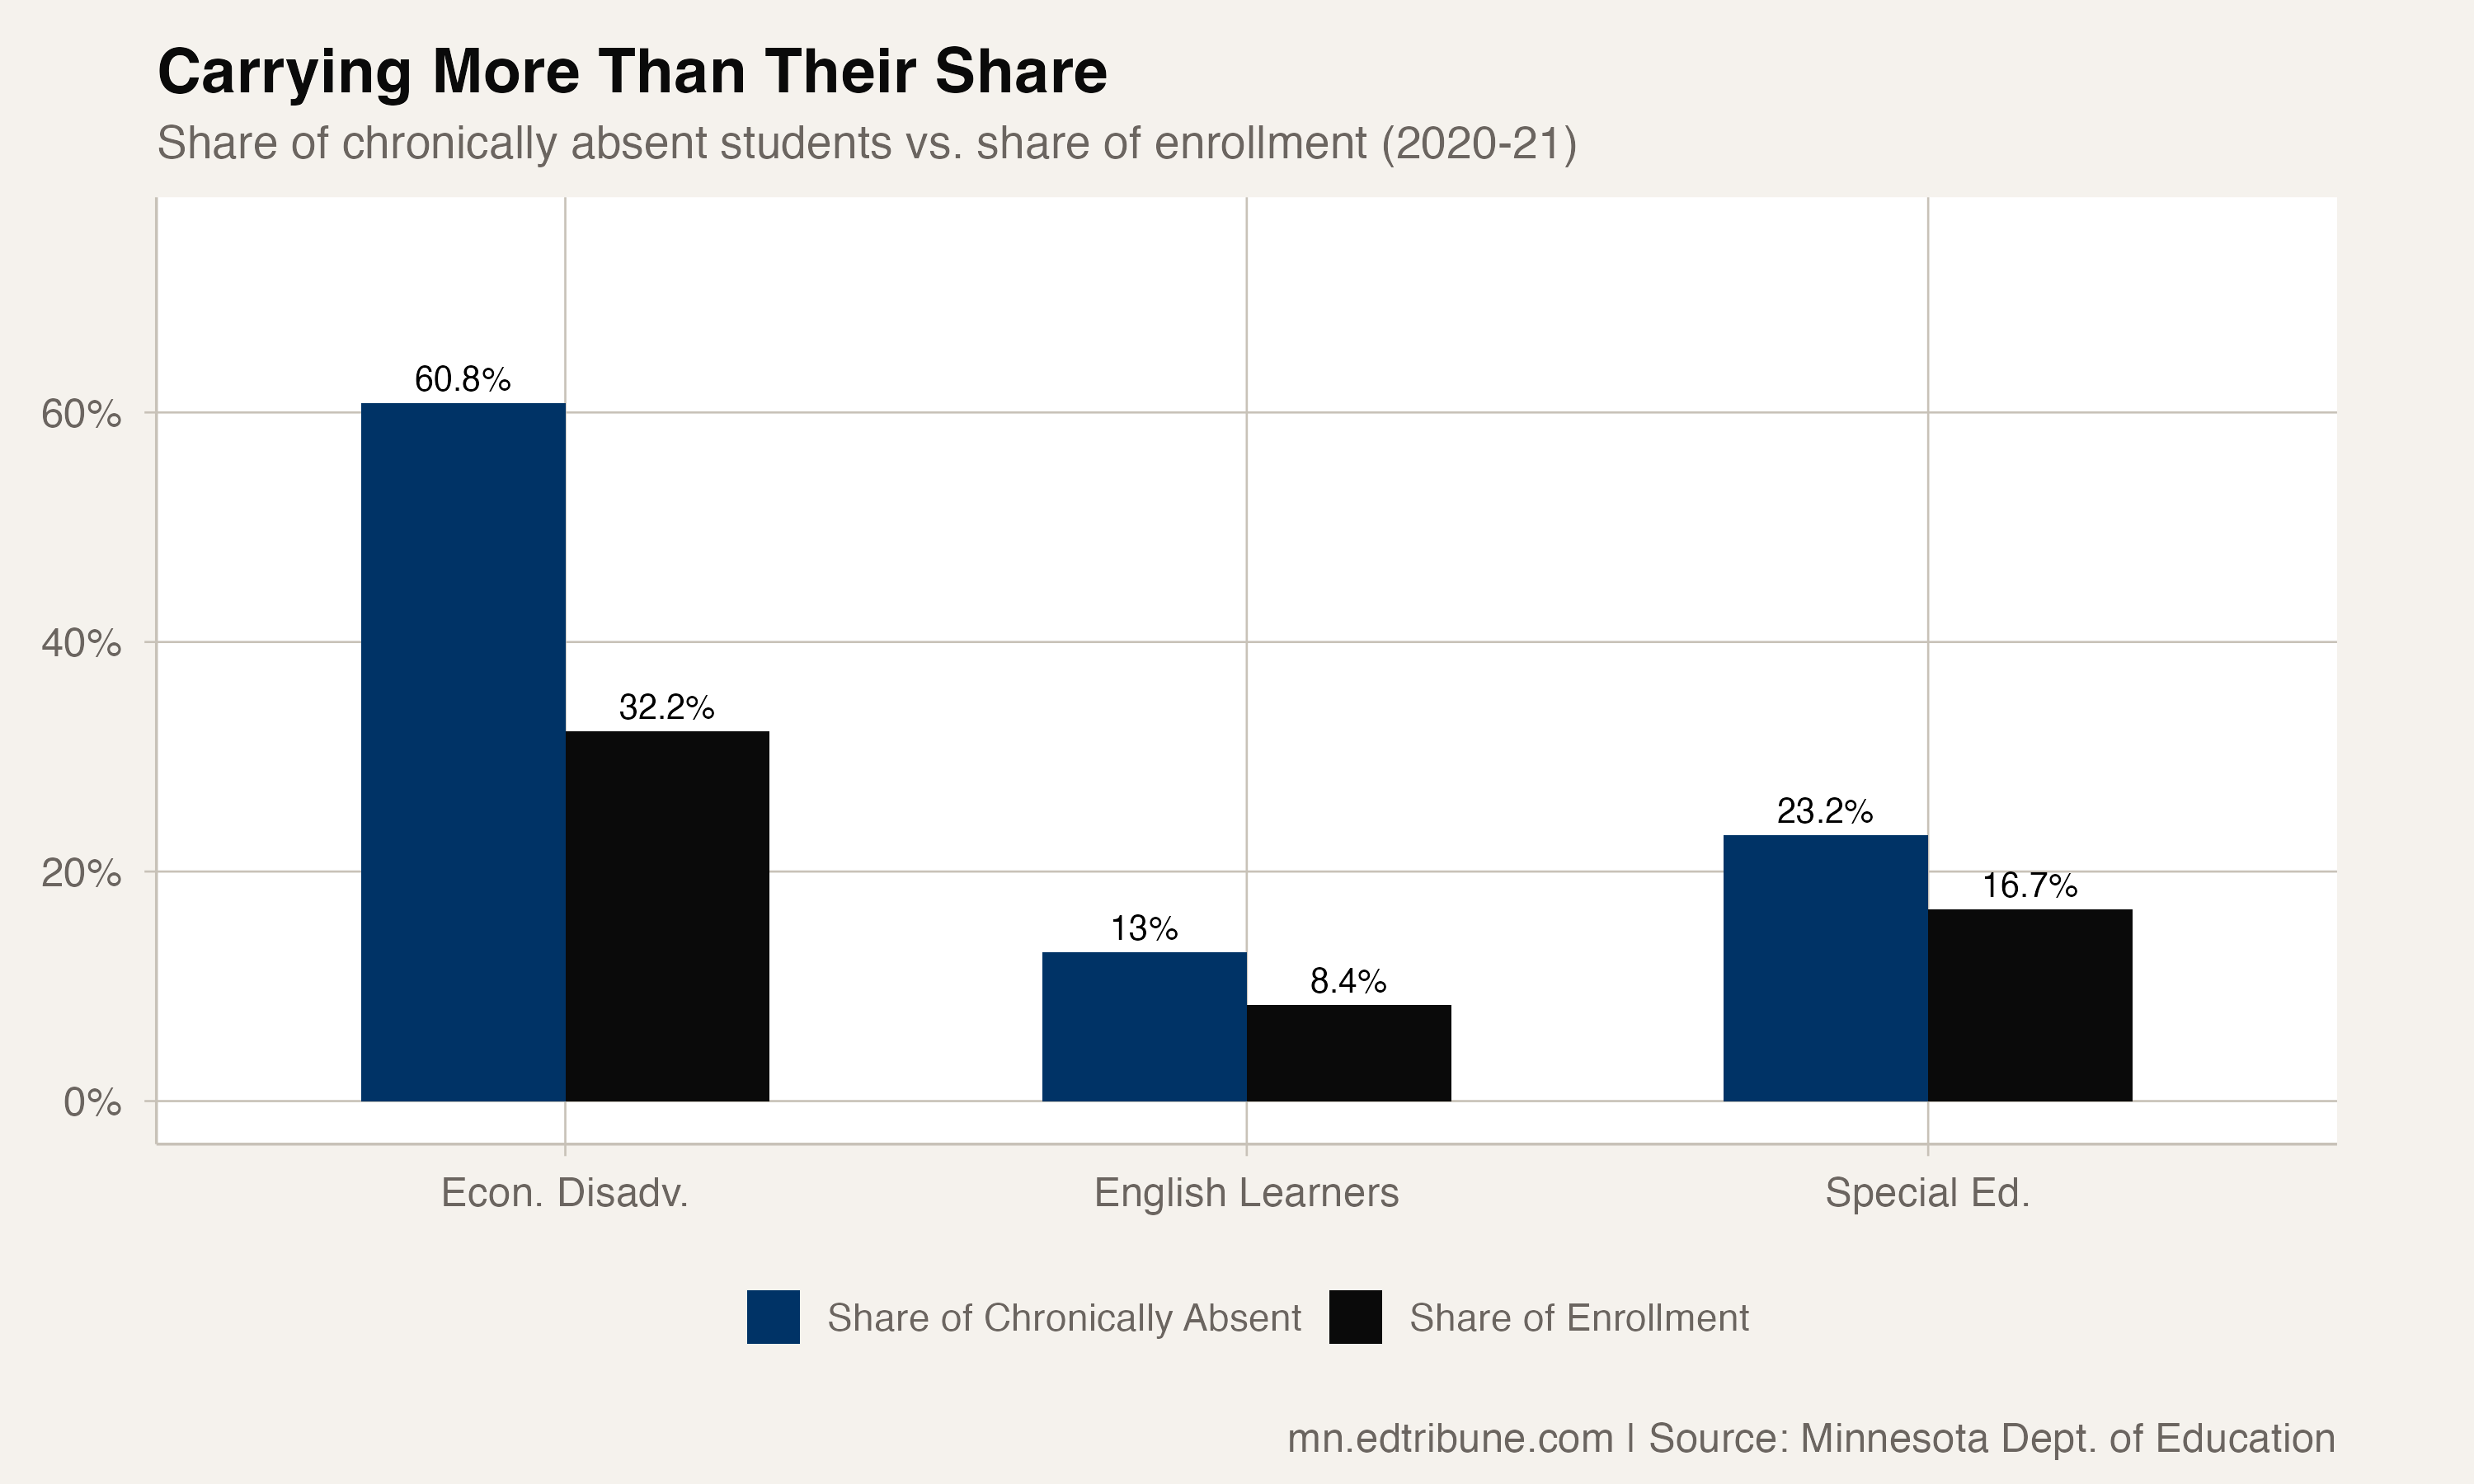
Economically disadvantaged students made up 32.2% of Minnesota enrollment in 2020-21 but accounted for 60.8% of all chronically absent students. Their share of chronic absence was nearly twice their share of enrollment.
English learners represented 8.4% of enrollment and 13.0% of chronic absence. Special education students represented 16.7% of enrollment and 23.2% of chronic absence.
The statewide rate of 21.5% therefore does not describe the differences among the student groups reported in the 2020-21 file.
The data gap that follows
These findings come from 2020-21, the only year in the available data with subgroup breakdowns. In 2021-22, 2022-23 and 2023-24, Minnesota's chronic absenteeism data carries all-students counts only, without racial, economic or special population disaggregation.
Minnesota's overall chronic absence rate declined from 26.2% to 21.4% between 2021-22 and 2023-24, a drop of 4.8 points. The published figures do not show whether economically disadvantaged students shared in that change. The state stopped publishing the subgroup breakdown after 2020-21.
Minnesota has also described attendance interventions outside this dataset. Without subgroup data after 2020-21, the state's published figures cannot show whether later efforts reached the students with the highest reported absence rates.
Analysis based on chronic absenteeism and enrollment data from the Minnesota Department of Education, covering 2020-21 through 2023-24, with enrollment through 2025-26. Subgroup breakdowns of chronic absenteeism are available only for 2020-21. Rates are computed by dividing published chronic absence counts by published enrollment counts for the same student group and year.
"Economically disadvantaged" here means eligible for free or reduced-price lunch, the measure Minnesota reports alongside its attendance data. That eligibility count changed basis in 2022-23, when the statewide share rose by 11.8 percentage points; every poverty figure in this article predates that break and no trend is drawn across it.
Detailed code that reproduces the analysis and figures in this article is available exclusively to EdTribune subscribers.
Discussion
Sign in to join the discussion.
Loading comments...